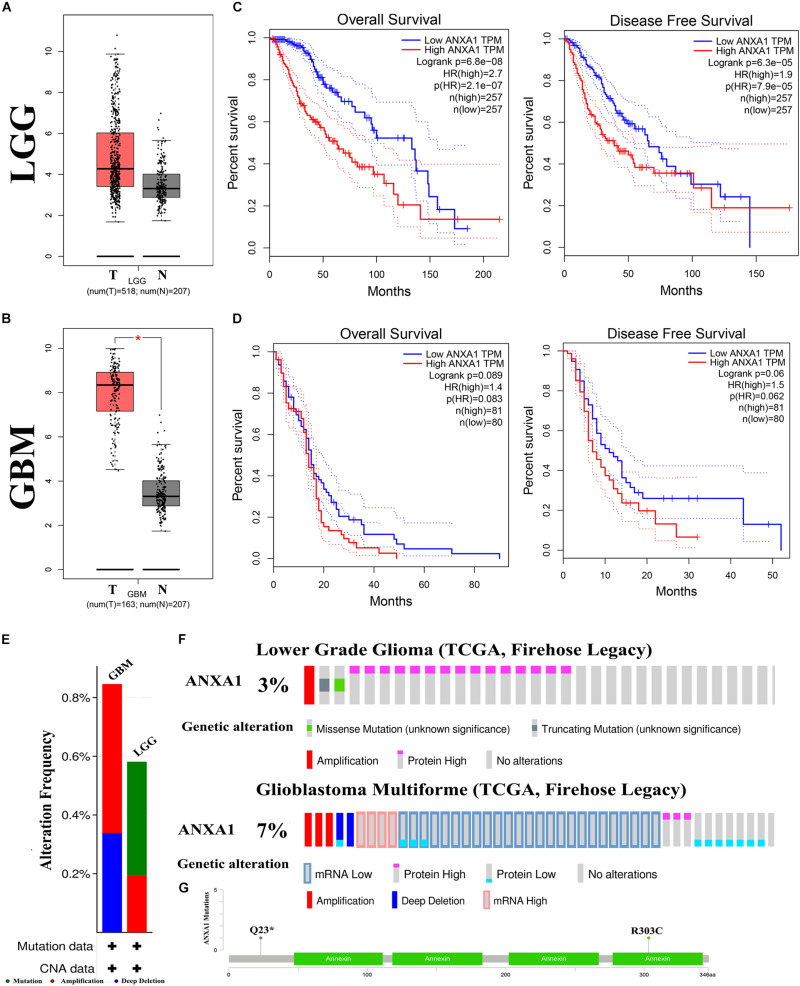
FIGURE 6.
Mutation and prognostic analysis of ANXA1 Expression in GEPIA and cBioPortal databases. (A,B) According the GEPIA database, the result of differential expression analysis of ANXA1 expression. Red represents cancer tissues and gray represents normal tissues in the LGG and GBM samples (*p < 0.05). (C,D) The overall survival and disease-free survival rate of ANXA1. (E) The mutation type of ANXA1. (F) The mutation analysis of ANXA1. (G) The common mutation site are Q23 and R303C.

