
Figure 1.
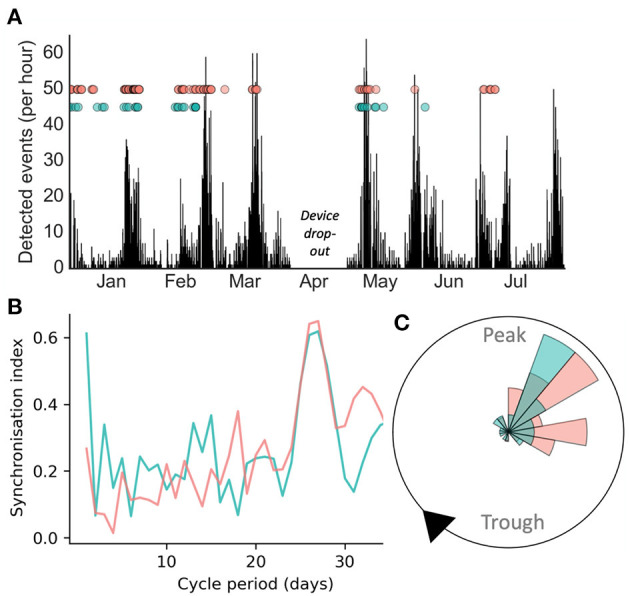
Case study of electrographic seizure detection from sub-scalp EEG (red) and seizure diary self-reported events (green) over >6 months in an individual patient. (A): counts of detected epileptiform events over time, with seizures shown as dots. (B) Synchronisation index measured from event times at different fixed cycle periods showed a similar peak around 28-days for both EEG and self-reported seizures (C) A polar plot demonstrating that both diary and EEG seizures show similar phase distributions with respect to the underlying 28-day cycle.