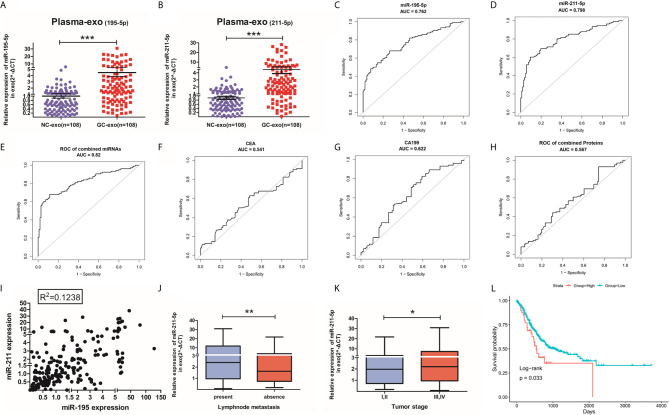
Figure 3.
Validation of miR-195-5p or miR-211-5p and their diagnostic accuracy. (A, B). Large-scale analysis(n=88) of plasma exosomal miR-195-5p and miR-211-5p levels were assessed with qRT-PCR. (C–E). ROC curve of miR-195-5p, miR-211-5p and their combination in the validation population. (F–H). ROC curve of CEA, CA19-19 and their combination in validation population. (I). Scatter plot of the linear distribution of miR-195-5p and miR-211-5p expression in all samples during both phases of training and validation. (J, K). Expression of exosomes miR-211-5p in lymph node metastasis circumstances and different tumor stages(*p-value<0.05, **p-value<0.01, ***p-value<0.001). (L). OS and survival curves of miR-211-5p expression in gastric cancer in TCGA. (Top-10percentage: indicates that the 10% patients with the highest expression are compared with the 75% low expression patients).

