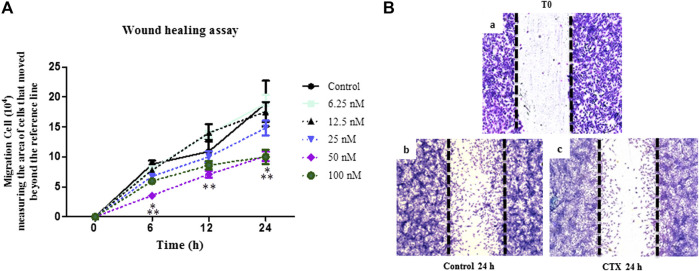
FIGURE 2.
Effect of CTX on t.End.1 migration in the Wound healing model at different treatment periods. Wound healing assay performed in t.End.1 cells treated with different CTX concentrations (6.25, 12.5, 25, 50, 100 and 200 nM) for 0, 6, 12 and 24 h at 37°C and 5% CO2. (A) Results are expressed as Number of Migrated Cells and represent the mean ± s.e.m. The data are presented from three distinct experiments run in at least in triplicate each group. *p < 0.05 compared to the control group, **p < 0.05 compared to other CTX concentrations. (B) Photomicrographs obtained at time 0 and 24 h at ×10 magnification. The images were collected under an Olympus BX 51 microscope, using the Image-Pro Plus 5.1 software, in a ×10 objective.

