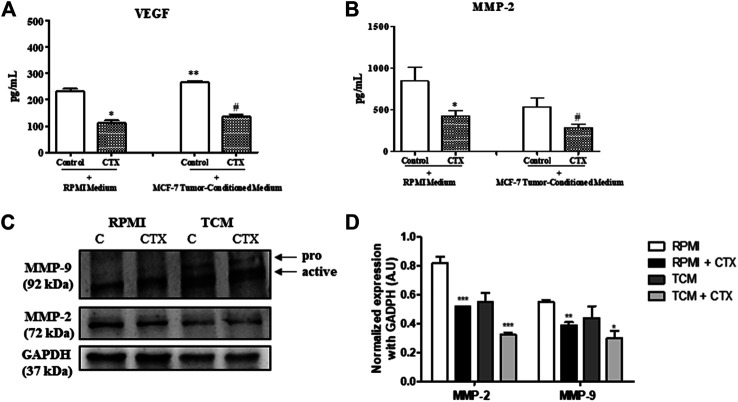
FIGURE 5.
Effect of CTX on the VEGF and MMPs. CTX-pretreated t.End.1 cells were incubated for 24 h in the presence of the fresh medium. Then, the supernatants were collected 99 for measurement of VEGF (A) and MMP-2 (B) concentrations by means of enzyme immunoassay (EIA) using a commercial kit. Data are mean ± s.e.m. Data are the average of four samples of each group ± s.e.m and represent two distinct trials. *p < 0.01, compared to RPMI control group. **p < 0.05, compared to RPMI control group, #p < 0.01, compared to MCF-7-CM. Western blotting analysis of protein expression levels of MMP-2 and MMP-9 (C). The values were normalized by GAPDH expression and band intensities were quantified by densitometry of the homogenate Western blots (D) and represented the mean ± s.e.m. for three samples per group and represent three independent assays. *p < 0.05 by comparison with the respective control groups. **p < 0.01 by comparison with the respective control groups. ***p < 0.001 by comparison with the respective control groups.

