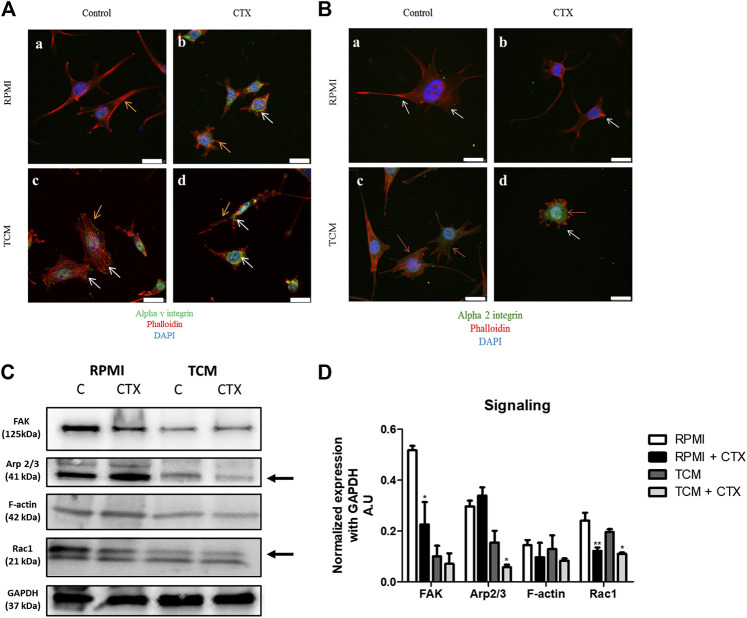
FIGURE 6.
Effect of CTX on actin cytoskeleton, intracellular signaling and integrin expression in t.End.1 endothelial cells in the different microenvironments. In (A), marking of αv subunit (green) and F-actin (red) of control cells incubated with RPMI 1640 medium (a) or MCF-7-CM (b). CTX-treated cells are labeled in (b,d). In (B), marking of α2 subunit (green) and F-actin (red) of control cells incubated with RPMI 1640 medium (a) or MCF-7-CM (b). CTX-treated cells are labeled in (b,d). Orange arrows represent the expression of αv and α2 in the cell (green); White arrows represent the cytoskeleton protrusions (red). For details of the experiments, please see the Materials and Methods section. Scale bar: 25 μm. Western blotting was performed for the analysis shown in (C), integrin-mediated signaling: FAK, Arp2/3, F-actin and Rac-1 expression levels. The values were normalized by GAPDH expression and band intensities were quantified by densitometry of the homogenate western blots and represented the mean ± s.e.m. for three samples per group and represent three separate assays (D). *p < 0.05 by comparison with the respective control groups. **p < 0.01 by comparison with the respective control groups. ***p < 0.001 by comparison with the respective control groups.

