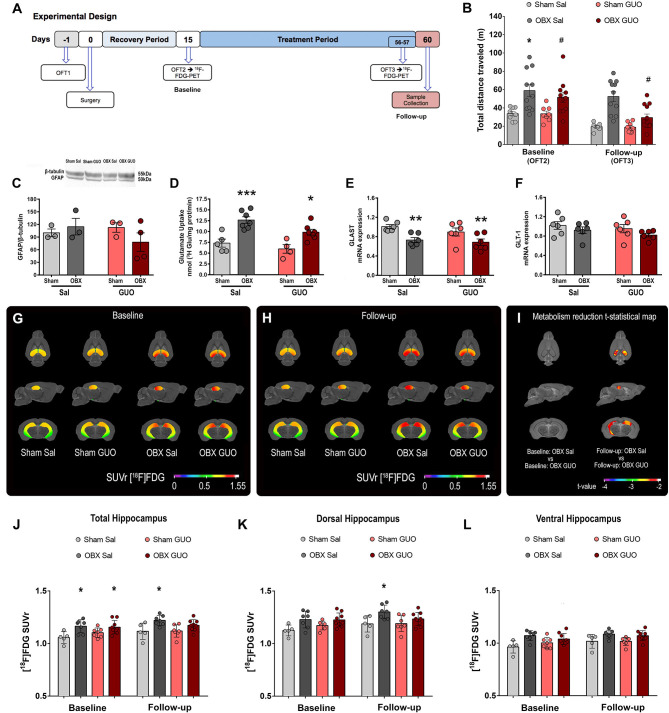
Figure 3.
Cohort 3: Study design (A). Effects of surgery and treatment on locomotion at the OFT3 (B). GFAP/β-actin (C), glutamate uptake (D), and mRNA levels of GLAST (E) and GLT-1 (F) in the hippocampus. Columns represent mean ± S.E.M. (n = 8–11 mice/group). *p < 0.05, **p < 0.01, ***p < 0.001 Sham x respective OBX; #p < 0.05 OBX GUO x Sal, two-way ANOVA/Tukey. Brain metabolic maps showing the mean SUVr in the hippocampus of groups Sham Sal, Sham GUO, OBX Sal, and OBX GUO in the baseline (G) and follow-up (H) scans. T-statistical maps showing the statistically significant decrease in metabolism in the hippocampal region on the OBX GUO follow-up group in comparison with the group OBX Sal follow-up (I). VOI means [18F]FDG SUVr values in the total hippocampal region (J), in the dorsal hippocampal region (K), and in the ventral hippocampal region (L). All images are projected into a standard magnetic resonance imaging (MRI) image in axial, sagittal, and coronal planes. Data represented as mean ± S.D. *p < 0.05 (multiple comparisons—three-way ANOVA with repeated measures).

