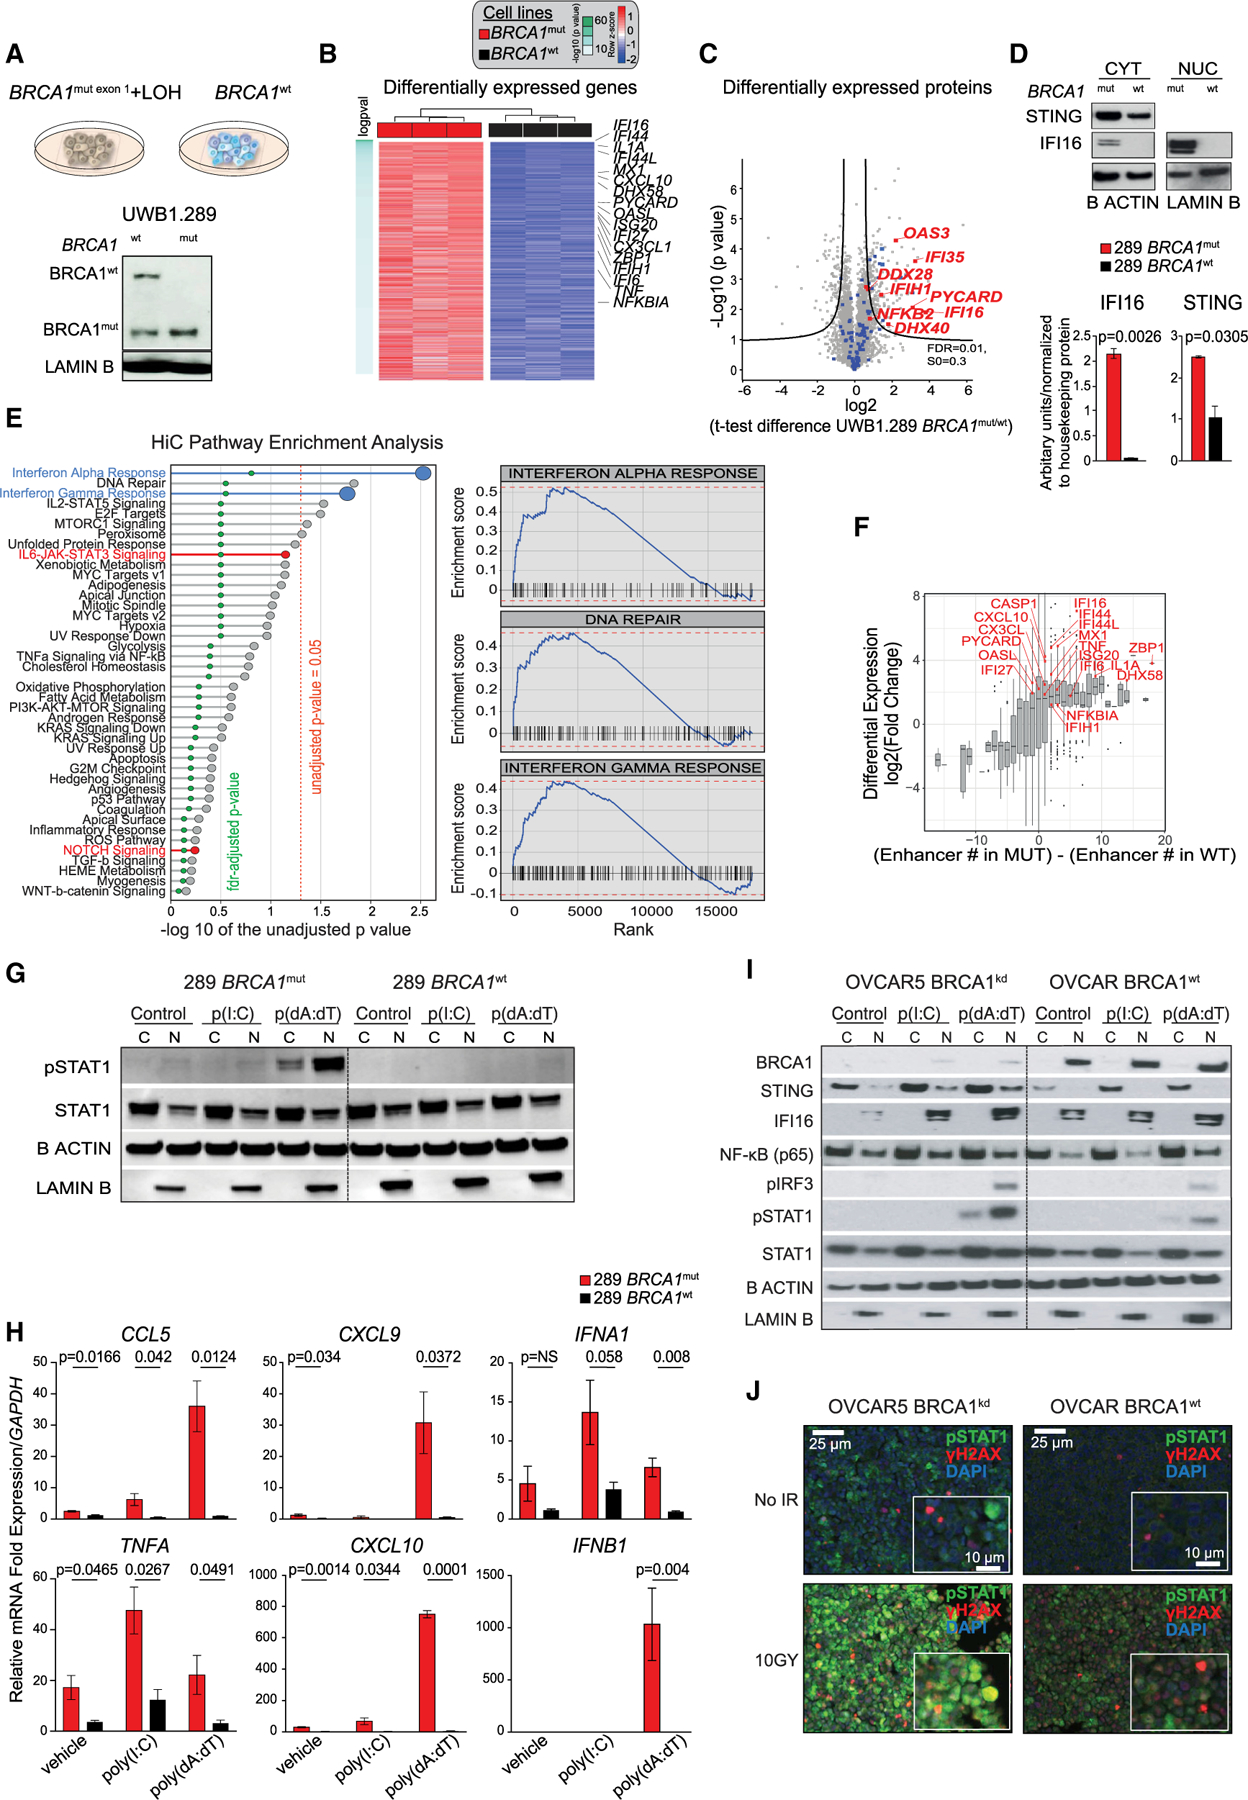
Figure 1. BRCA1 loss leads to transcriptional reprogramming of ovarian cancer cells and results in overexpression of the DS/IFN pathway.

(A) (Upper) UWB1.289 cell lines: UWB1.289 BRCA1mut with concomitant loss of wild-type (WT) allele through LOH and WT BRCA1-reconstituted isogenic cell line. (Lower) Western blot (WB) analysis of BRCA1 in nuclear (N) extracts of BRCA1mut and BRCA1WT cells.
(B) Heatmap of hallmark signatures with significantly different enrichment score between BRCA1mut and BRCA1WT isogenic cell lines (adjusted p value of <0.05 after linear regression) at the proteomics level.
(C) Volcano plot of differentially expressed proteins in the BRCA1mut and BRCA1WT cell lines by MS. Immune-related proteins are highlighted in blue; selected genes of interest are highlighted in red. The position on the right side of the plot indicates higher expression in the BRCA1mut cell line. Black curves represent significance cutoff (t test permutation-based false discovery rate [FDR] < 0.01, S0 = 0.3).
(D) WB analysis for STING and IFI16 in cytoplasmic (CYT) and nuclear (NUC) extracts of BRCA1mut and BRCA1WT cells (n = 3). The signal obtained for each protein was normalized to that of housekeeping β-actin and lamin B in CYT and NUC, respectively. Data are presented as mean ± SEM. p values were calculated by an unpaired t test.
(E) Pre-ranked gene set enrichment analysis using the difference in the number of enhancers between BRCA1mut and BRCA1WT cell lines as a ranking factor. Pathways enriched in BRCA1WT are in red. All of the others were found in the BRCA1mut. Right panels display the three most enriched pathways in BRCA1mut.
(F) Association of differentially expressed genes and the presence of enhancers in the BRCA1mut versus the BRCA1WT cells by RNA-seq, Hi-C, and H3K27ac ChIP-seq. Genes in red are those implicated in the DS/IFN pathway.
(G) WB analysis for pSTAT1 and total STAT1 in the cytoplasmic (C) and nuclear (N) fractions of BRCA1mut and BRCA1WT cells treated with liposomes or poly(I:C)- or poly(dA:dT)-loaded liposomes. β-Actin and lamin B were used as protein loading controls in C and N, respectively.
(H) RT-PCR analysis of CCL5, CXCL9, IFNA1, TNFA, CXCL10, and IFNB1 in BRCA1mut and BRCA1WT cells treated with liposomes or poly(I:C)- or poly(dA:dT)-loaded liposomes (n = 3). Data are presented as mean ± SEM. p values were calculated by an unpaired t test.
(I)WB analysis of BRCA1, STING, IFI16, NF-κB, pIRF3, pSTAT1, and total STAT1 in the C and N fractions of OVCAR5 BRCA1kd and BRCA1WT cells treated with liposomes or poly(I:C)- or poly(dA:dT)-loaded liposomes.
(J)Immunofluorescence (IF) analysis of pSTAT1 (green), γH2AX (red), and DAPI (blue) in BRCA1kd and BRCA1WT cells 48 h after irradiation (10 Gy). Scale bars, 25 mm (10 μm in insets).
