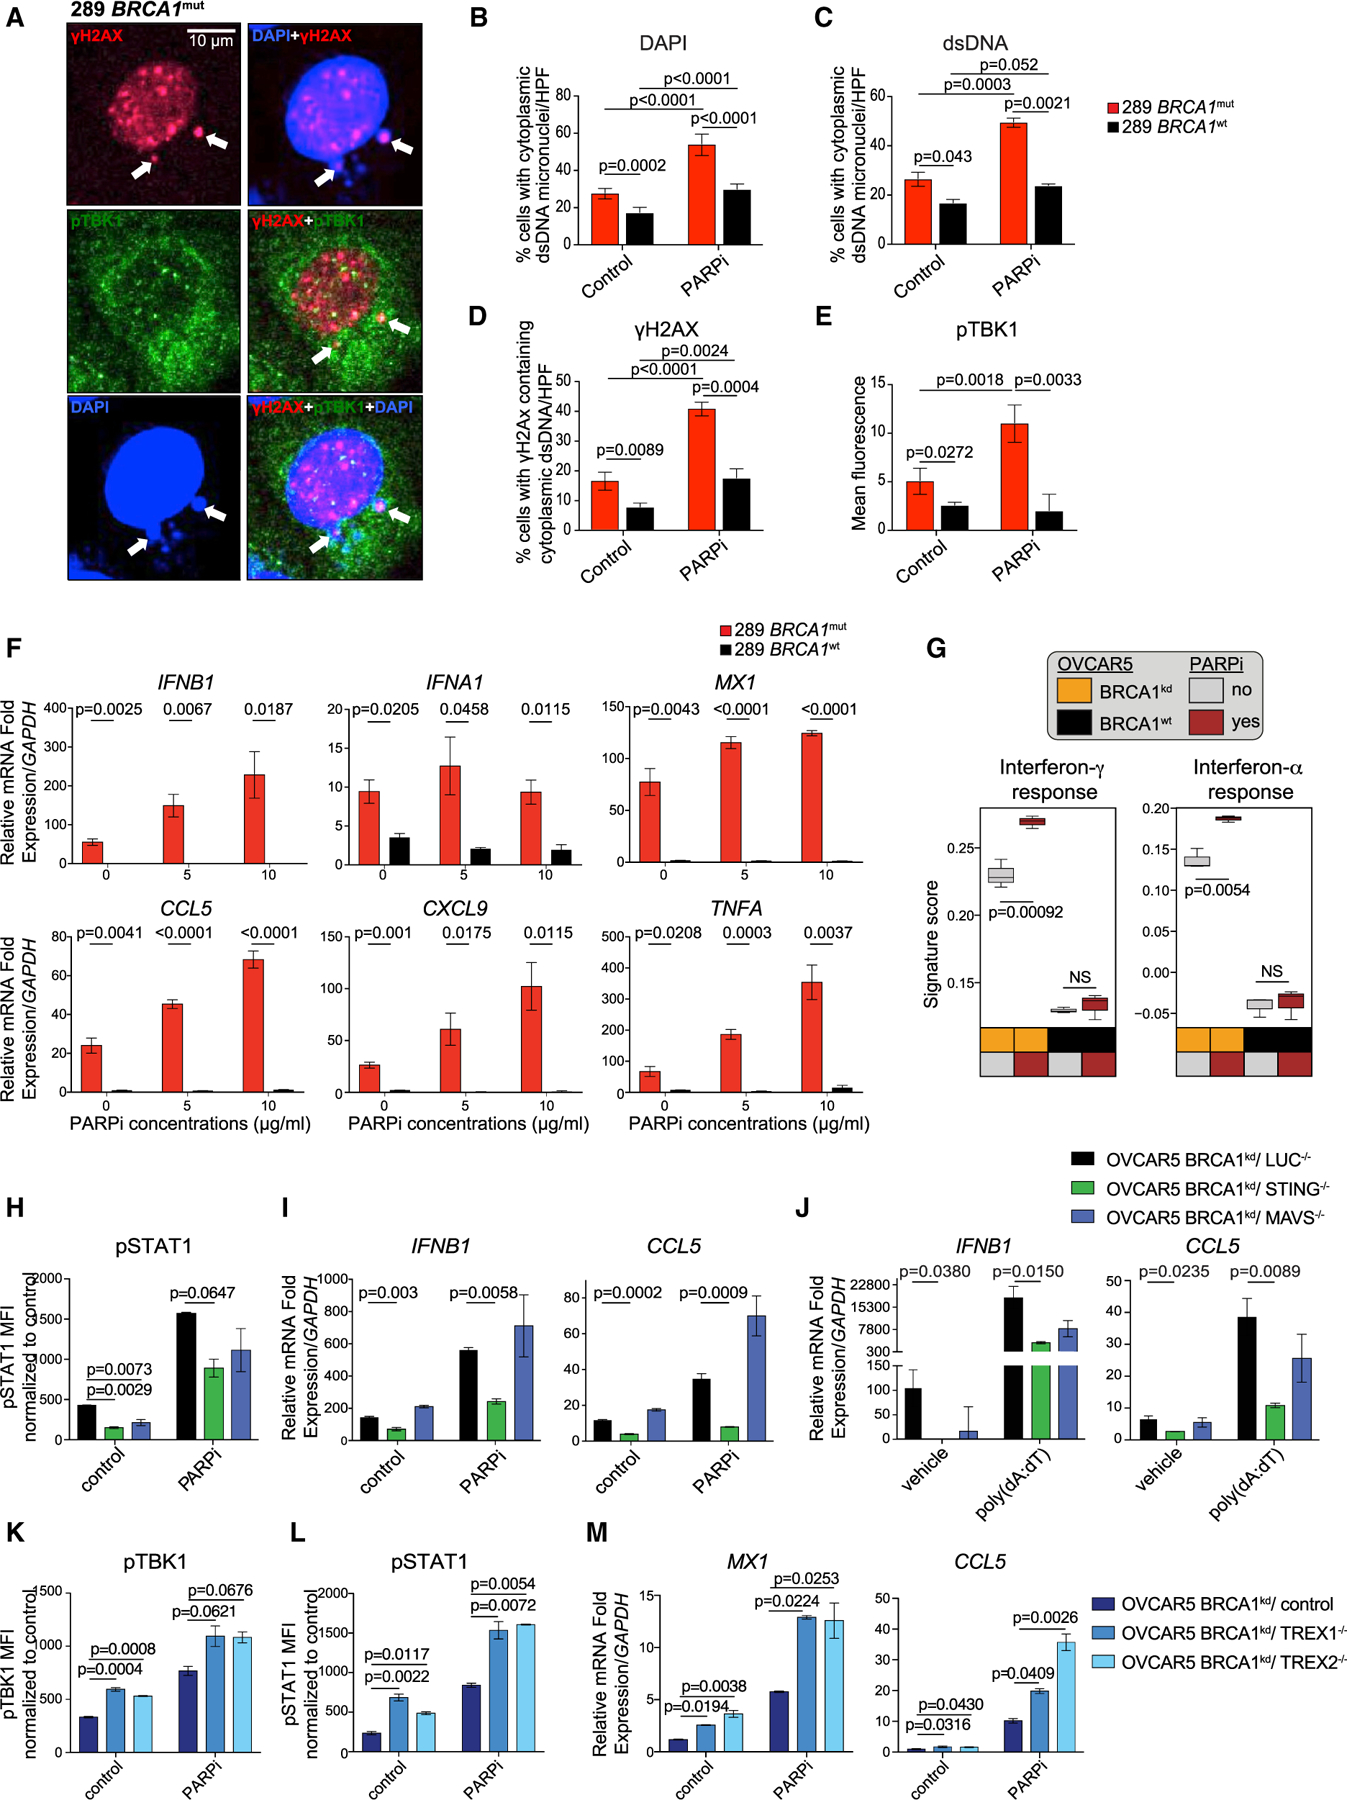
Figure 2. BRCA1 loss in ovarian cancer cells leads to a cell-autonomous inflammatory state through tumor-cell-intrinsic STING/pTBK1 pathway activation, which is exacerbated by PARP inhibition.

(A) High magnification of a cell with histone-derived cytoplasmic dsDNA micronuclei stained by anti-phospho-histone H2AX (Ser139) (red) and DAPI (blue), and cytosolic expression of pTBK1 (green) in BRCA1mut cells (white arrow). Scale bar, 10 μm.
(B and C) Percentage of cells/high-power field (HPF) carrying cytoplasmic dsDNA micronuclei as detected by DAPI (B) and anti-dsDNA-specific antibody (C) in BRCA1mut and BRCA1WT cell lines treated with DMSO or olaparib (n = 4). Data are presented as mean ± SEM. p values were calculated by an unpaired t test.
(D) Percentage of cells/HPF carrying histone-derived cytoplasmic γH2AX+ dsDNA in BRCA1mut and BRCA1WT cells treated with DMSO or olaparib (n = 3). Data are presented as mean ± SEM. p values were calculated by an unpaired t test.
(E) Mean fluorescence intensity (MFI) of pTBK1 staining in BRCA1mut and BRCA1WT cells treated with DMSO or olaparib (n = 3). Data are presented as mean ± SEM. p values were calculated by an unpaired t test.
(F)RT-PCR of IFNB1, IFNA1, MX1, CCL5, CXCL9, and TNFA in BRCA1mut and BRCA1WT cells 48 h after DMSO or olaparib (n = 3). Data are presented as mean ± SEM. p values were calculated by an unpaired t test.
(G) MS of IFNγ and IFNα responses in OVCAR5 BRCA1 isogenic cell lines (n = 3) 48 h after DMSO or olaparib. Boxplots represent the 25th and 75th percentiles, with the midline indicating the median; whiskers extend to the lowest/highest values. p values were computed by ANOVA followed by a Tukey’s post hoc test for multiple comparison correction.
(H and I) MFI quantified by FACS for pSTAT1 (H) and RT-PCR analysis of IFNB1 and CCL5 expression (I) in OVCAR5 BRCA1kd cells crispered for luciferase, STING, and MAVS 48 h after DMSO or olaparib (n = 3). Data are presented as mean ± SEM. p values were assessed by a one-way ANOVA.
(J) RT-PCR analysis of IFNB1 and CCL5 expression in OVCAR5 BRCA1kd cells crispered for luciferase, STING, and MAVS treated with liposomes or poly(dA:dT)-liposomes (n = 3). Data are presented as mean ± SEM. p values were assessed by a one-way ANOVA.
(K–M) MFI quantified by FACS for pTBK1 (K) and pSTAT1 (L) and RT-PCR analysis of MX1 and CCL5 expression (M) in OVCAR5 BRCA1kd cells transduced with a control, TREX1, or TREX2 CRISPR 48 h after DMSO or PARPi treatment (n = 3). Data are presented as mean ± SEM. p values were assessed by a one-way ANOVA.
See also Figures S2 and S3.
