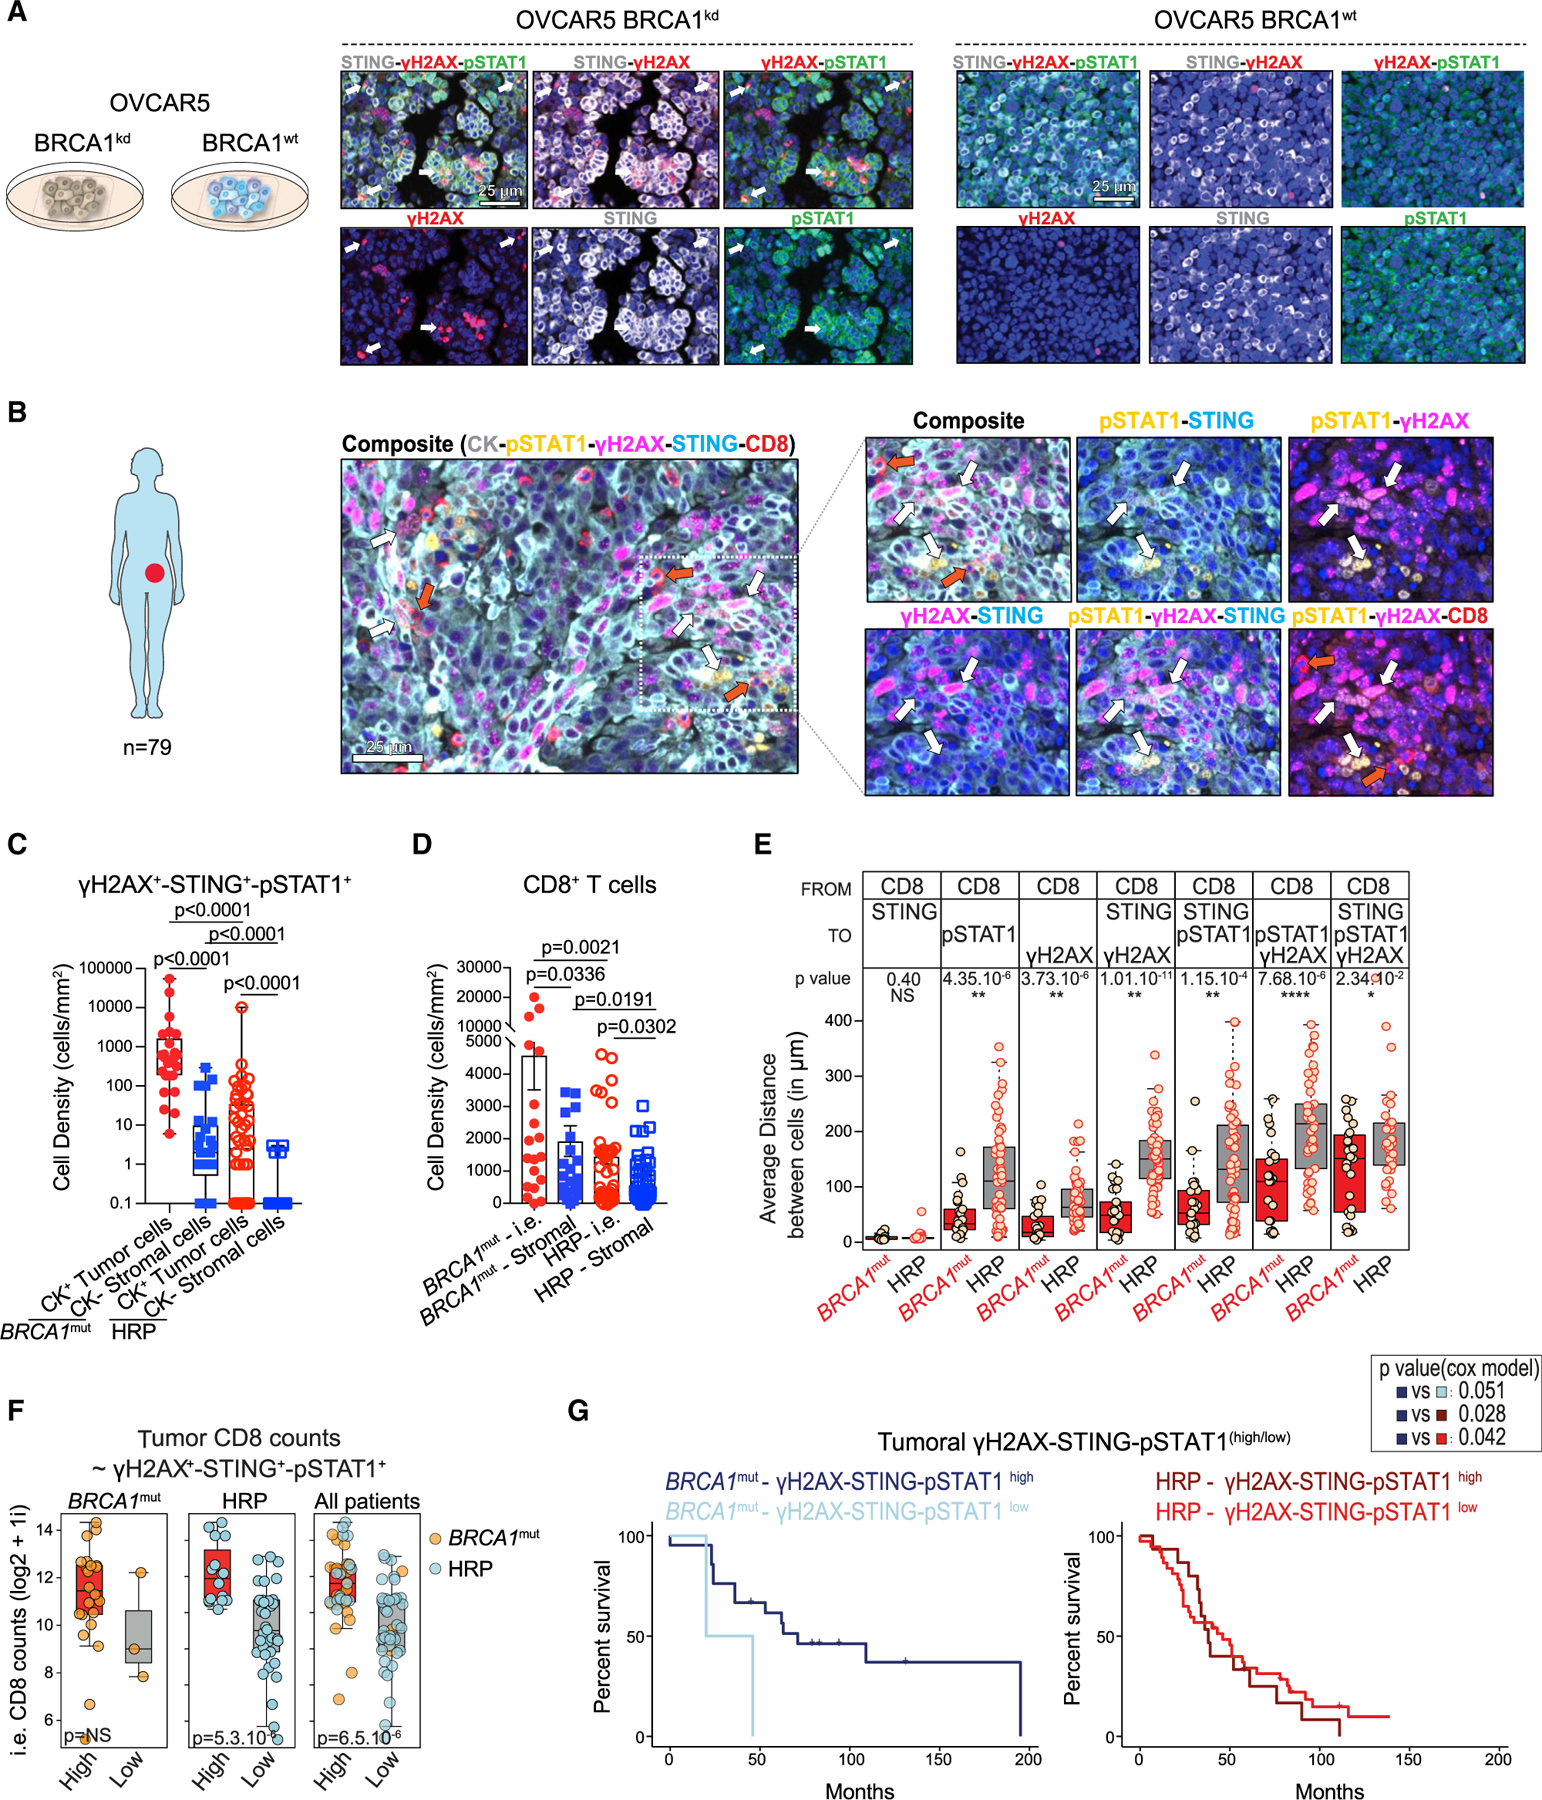
Figure 3. BRCA1-mutated HGSOC tumors are inflamed and have DNA damage and IFN activation in situ.

(A) Multiplex IF for STING (gray), pSTAT1 (green), γH2AX (red), and DAPI (blue) in OVCAR5 BRCA1kd and BRCA1WT cells 48 h after irradiation. White arrows show examples of cytoplasmic dsDNA micronuclei labeled by DAPI, γH2AX, and phosphorylated STAT1. Scale bars, 25 μm.
(B) Representative IF image of CK (gray), pSTAT1(yellow), γH2AX (magenta), STING (blue), and CD8 (red) in a case of BRCA1-deficient (BRCA1mut) HGSOC. White arrows indicate CK+γH2AX+STING+pSTAT1+ cells. CD8+ TILs surrounding the γH2AX+STING+pSTAT1+ tumor cells are indicated by red arrows. Scale bar, 25 μm.
(C) Quantification of γH2AX+STING+pSTAT1+ in CK+ and CK− cells in BRCA1mut and HR-proficient (HRP) HGSOCs (n = 25 and 54, respectively). Boxplots represent 25th and 75th percentiles, with the midline indicating the median; whiskers extend to the lowest/highest values, and points indicate values for individual patients. p values were calculated by a Mann-Whitney test.
(D) Quantification of intraepithelial (i.e.) and stromal CD8+ T cells in BRCA1mut and HRP HGSOCs (n = 25, 54, and 5, respectively). Data are presented as mean ± SEM. Each dot represents an individual patient. p values were calculated by a Mann-Whitney test.
(E) Averages of the nearest neighbor distance analysis of CD8+ T cells to STING+, pSTAT1+, and/or γH2AX+ tumor cells in BRCA1mut and HRP HGSOCs. Boxplots represent 25th and 75th percentiles, with the midline indicating the median and each dot representing an individual patient. p values were calculated by a Student’s t tests.
(F) Boxplots showing i.e. CD8+ densities in STING-pSTAT1-γH2AXhigh and STING-pSTAT1-γH2AXlow tumor cells. The triple staining was categorized into high and low groups using the median over the whole cohort. Boxplots represent 25th and 75th percentiles, with the midline indicating the median and each dot representing an individual patient. p values were calculated by Student’s t tests.
(G) Kaplan-Mayer survival analyses of BRCA1mut and HRP HGSOCs expressing high or low levels of tumoral γH2AX, STING, and pSTAT1. p values were extracted from Cox proportional hazards tests.
See also Figure S4.
