
Figure 4. BRCA-deficient HGSOCs exhibit variable degrees of DNA damage, IFN activation, and T cell inflammation.
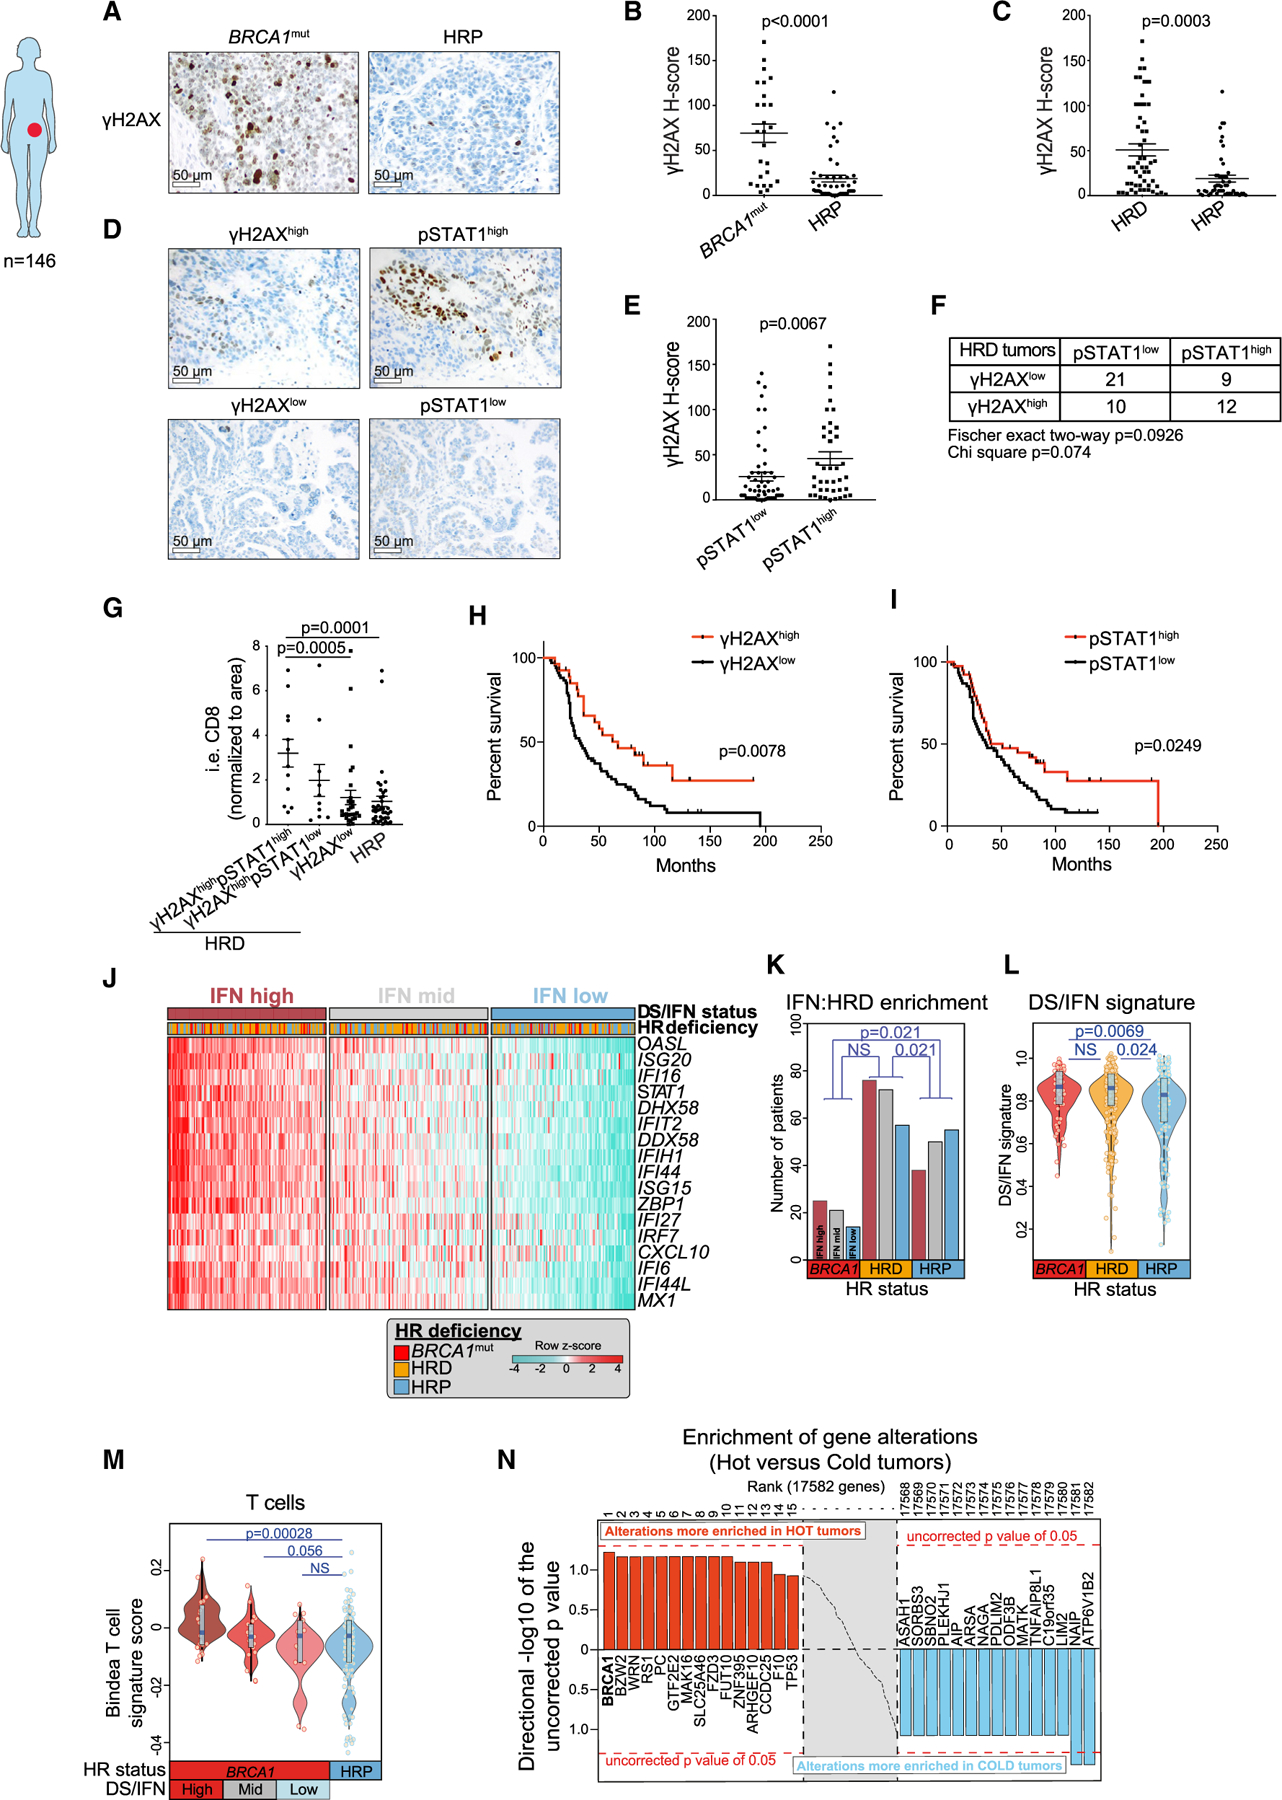
(A) Representative IHC staining of human HGSOC tissue for γH2AX tumor cell expression in BRCA1mut and HRP cancers. Scale bars, 50 mm.
(B and C) Quantification of tumor-expressed γH2AX staining in BRCA1mut (n = 26) and HRP (n = 49) tumors (B) and in HR-deficient (HRD) (n = 53) and HR-proficient (HRP) (n = 49) tumors. Data are presented as mean ± SEM, and points indicate values for individual patients. p values were calculated by a Mann-Whitney test.
(D) Representative IHC staining of pSTAT1 expression in cases of γH2AXhigh and gH2AXlow HGSOCs. Scale bars, 50 μm.
(E) Quantification of γH2AX in pSTAT1high (n = 57) and pSTAT1low (n = 40) HGSOCs. Data are presented as mean ± SEM, and points indicate values for individual patients. p values were calculated by a Mann-Whitney test.
(F) Table summarizing the numbers of γH2AXhigh/low and pSTAT1high/low HRD tumors.
(G) Quantification of i.e. CD8+ T cells in γH2AXhighpSTAT1high (n = 12), γH2AXhighpSTAT1low (n = 30), and γH2AXlow HRD (n = 10) and HRP (n = 39) HGSOCs. Data are presented as mean ± SEM, and points indicate values for individual patients. p values were calculated by a Mann-Whitney test.
(H and I) Kaplan-Mayer survival analyses of OC patients with γH2AXhigh (n = 27) versus γH2AXlow (n = 67) (H) and pSTAT1high (n = 39) and pSTAT1low (n = 61) (I). p values were extracted from Cox proportional hazards tests.
(J) Heatmap showing TCGA ovarian carcinoma cohort (Agilent platform) ranked according to the DS/IFN signature score composed of the genes appearing as rows. The cohort was split into tertiles according to IFN signature score (high, mid, and low). BRCA1 mutant patients include those with somatic and germline mutations in BRCA1, and HRD patients include those with any somatic mutations or copy number loss of any gene implicated in HR (excluding BRCA1 mutations that are taken separately).
(K) Comparison of the numbers of BRCA1mut, HRD, and HRP HGSOCs that express high, medium, and low DS/IFN signature scores, respectively. p values were computed by a Fisher’s exact test comparing high and low IFN groups according to HRD groups.
(L) Comparison of the DS/IFN score between BRCA1mut, HRD, and HRP HGSOCs. Violin plots extend to lowest/highest values, and points indicate values for individual subjects. Median is displayed by middle lines. Each dot represents an individual patient. p values were calculated by a Wilcoxon rank-sum tests.
(M) Comparison of the Bindea T cell signature score in BRCA1mut split by DS/IFN groups and HRP TCGA HGSOCs. Violin plots extend to lowest/highest values, and points indicate values for individual subjects. Median is displayed by middle lines. Each dot represents an individual patient. p values were calculated by a Wilcoxon rank-sum tests.
(N) Unbiased enrichment analysis of gene alterations (CNV loss + mutations) in inflamed (or hot) versus non-inflamed (or cold) tumors of TCGA.