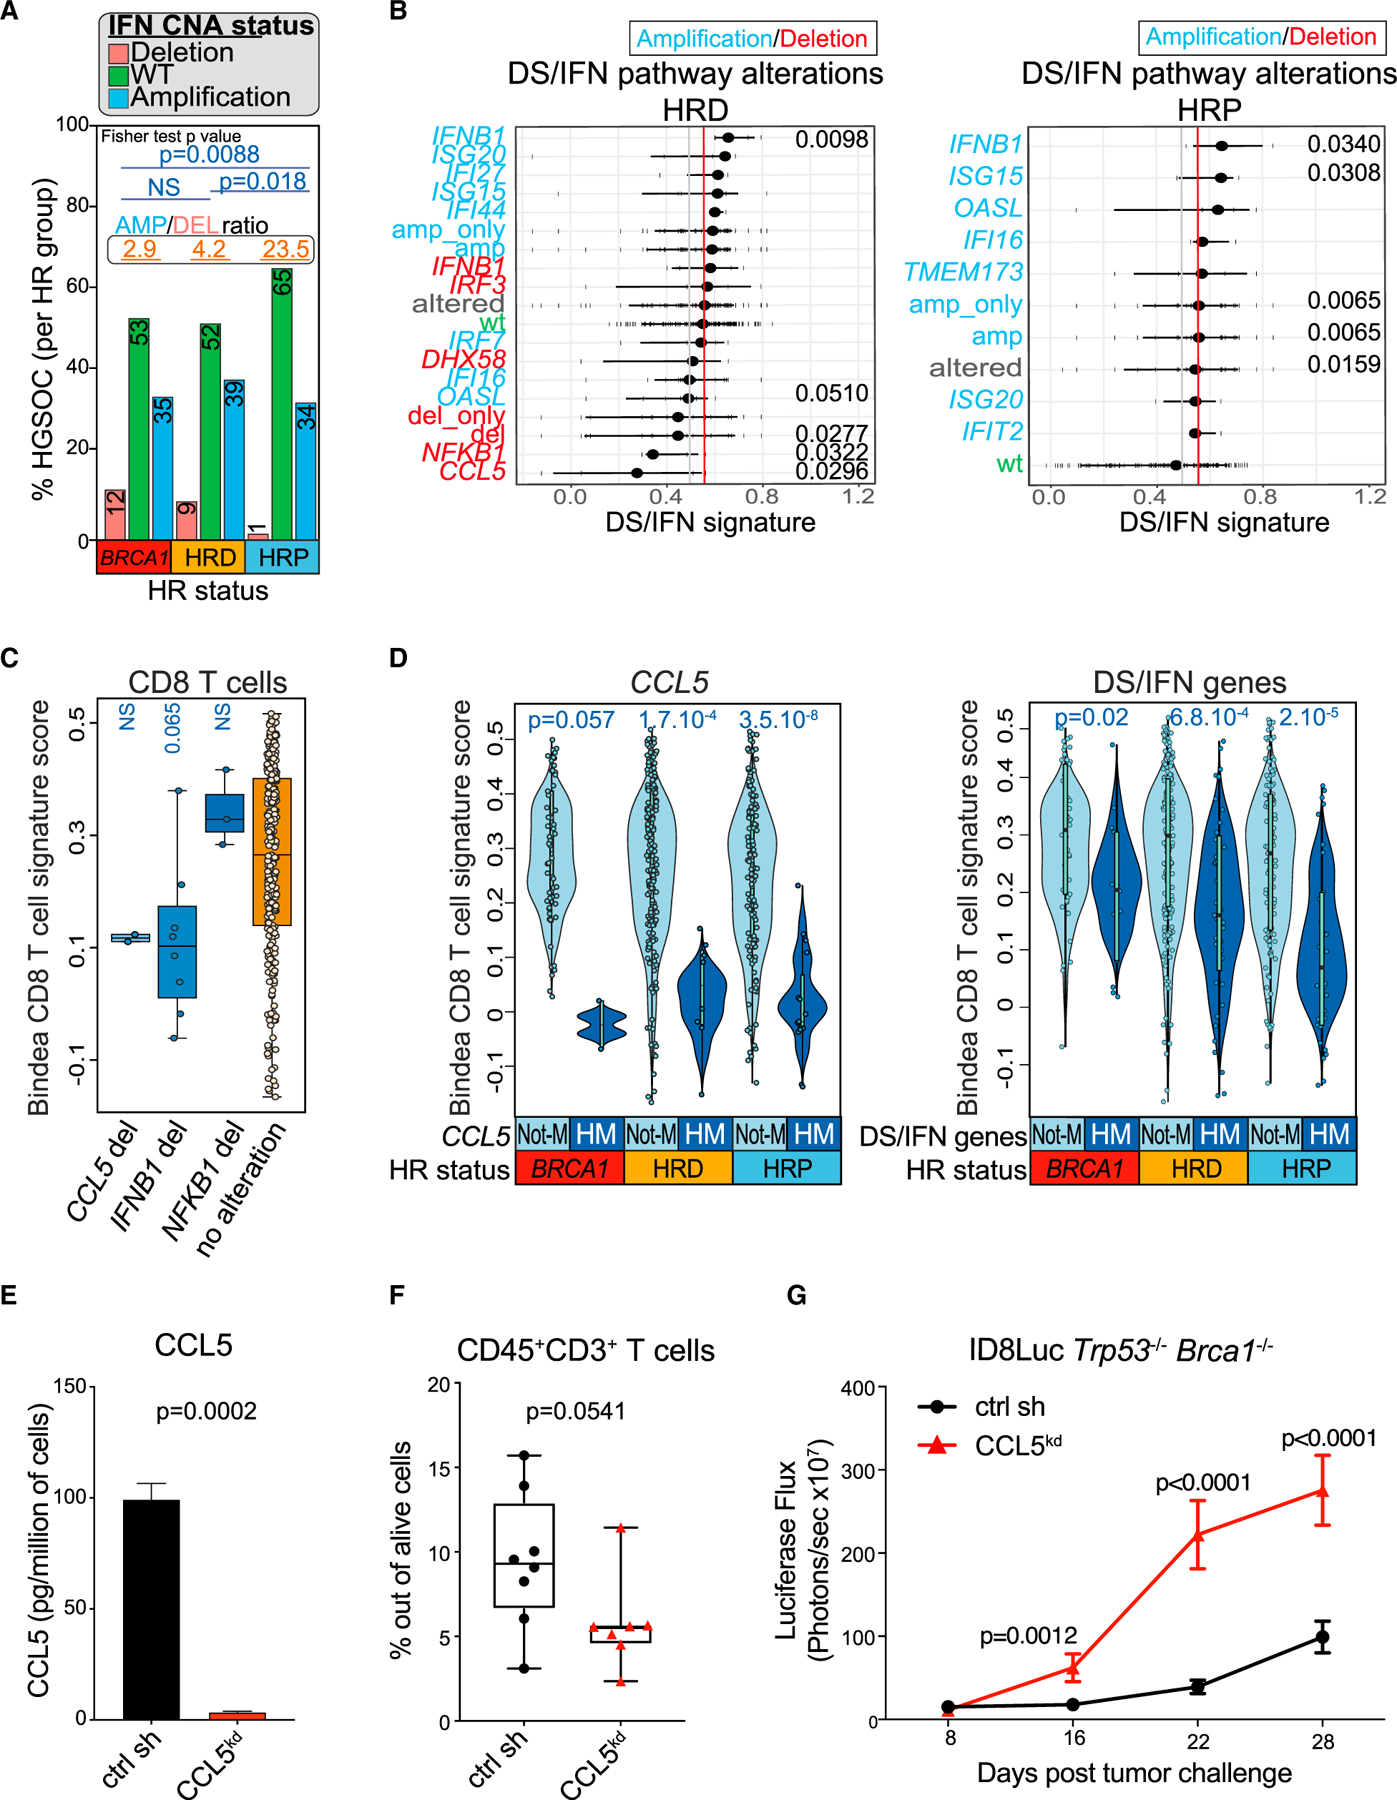
Figure 5. Loss of tumor-intrinsic CCL5 or type I IFN is associated with attenuated inflammation.

(A) Comparison of the DS/IFN gene CNA status in BRCA1 mutants, HRD and HRP HGSOCs. Ratio between amplified and deleted IFN groups are displayed at the top of each HRD group and number of patients in each bar graph. p values were calculated by a Fisher’s exact test.
(B) Association of DS/IFN gene impairment (deletion/amplification) in y axis and IFN pathway activation (DS/IFN signature score expression) in x axis in HRD and HRP TCGA HGSOCs from the Affymetrix platform. Whiskers represent 25th and 75th percentiles, with middle dots indicating the median. Each dot represents an individual tumor. Significant p values are shown in the graphs.
(C) Bindea CD8 T cell signature score (Bindea et al., 2013) in HRD tumors from patients carrying deletions in the CCL5, IFNB1, or NFKB1 genes versus not. Boxplots represent 25th and 75th percentiles, with the midline indicating the median; whiskers extend to the lowest/highest values, and points indicate values for individual subjects. p values were computed by a Wilcoxon rank-sum tests.
(D) Comparison of the Bindea CD8 T cell signature score in BRCA1mut, HRD, and HRP HGSOCs with HM or without HM (Not-M) of CCL5 or DS/IFN genes. Violin plots extend to lowest/highest values, and points indicate values for individual subjects. Median is displayed by middle lines. p values were computed by Wilcoxon rank-sum tests.
(E) CBA quantification of CCL5 in cell-free supernatants of Trp53−/−Brca1−/− CCL5kd and scr sh. The concentration (pg/mL) was normalized to cell number (n = 3). Data are presented as mean ± SEM. p values were computed by an unpaired t test.
(F) FACS quantification of CD3+ TILs in Trp53−/−Brca1−/− CCL5kd (n = 8) and scr sh (n = 7) intraperitoneal (i.p.) syngeneic tumors. Boxplots represent 25th and 75th percentiles, with the midline indicating the median; whiskers extend to the lowest/highest values, and points indicate values for individual subjects. p values were computed by a Mann-Whitney test.
(G) Luciferase-based tumor growth kinetics of ID8Luc Trp53−/−Brca1−/− CCL5kd (n = 8) and scr sh (n = 8) cancers. Data are presented as mean ± SEM. p values were computed by a two-way ANOVA.
See also Figures S5 and S6 and Table S4.
