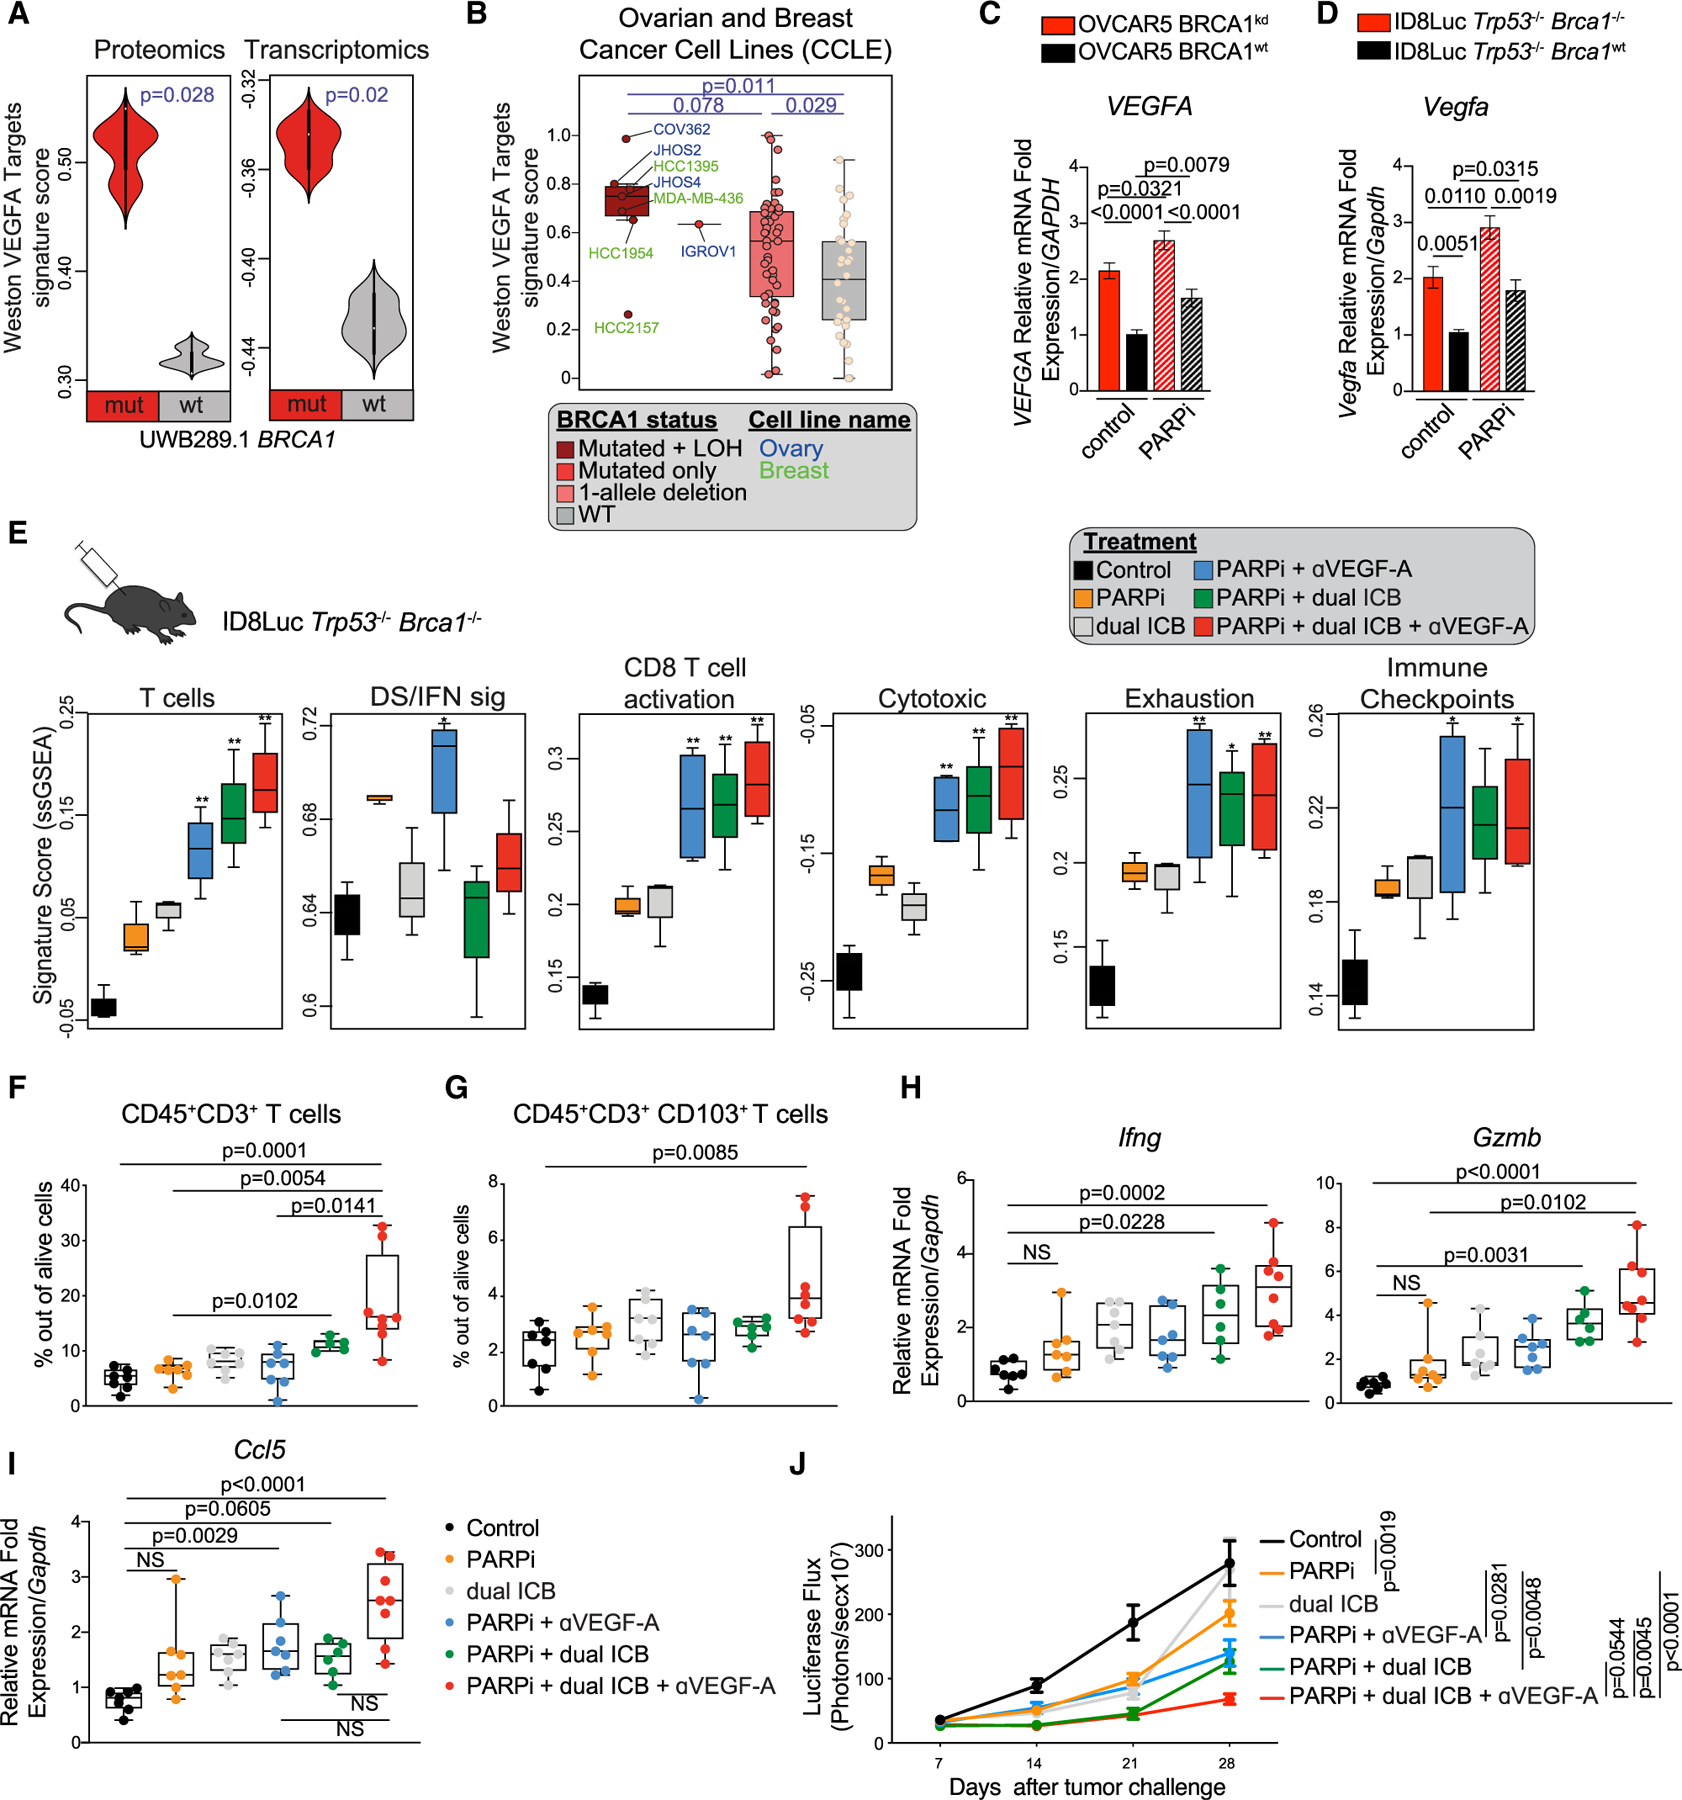
Figure 6. Immune checkpoint inhibitors and VEGF-A create immune resistance in Brca1-deficient tumors.

(A) Comparison of the “Weston VEGF targets 12hr” signature score (Weston et al., 2002) at the proteomic and transcriptomic levels between UWB1.289 BRCA1mut and BRCA1WT cell lines (n = 3). Violin plots extend to lowest/highest values, and embedded vertical boxes represent the 25th and 75th percentiles. Median is displayed by middle lines. Statistical significance was assessed by a Wilcoxon rank-sum tests.
(B) Comparison of the Weston VEGF targets 12hr signature score (Weston et al., 2002) in ovarian and breast cancer lines from the CCLE carrying BRCA1 mutations and LOH (complete BRCA1 functional loss), BRCA1 mutation only, CNV only (one allele deletion), or no alteration in BRCA1 (WT). Boxplots represent 25th and 75th percentiles, with the midline indicating the median; whiskers extend to the lowest/highest values, and points indicate values for individual cell lines. Statistical significance was assessed by Wilcoxon rank-sum tests.
(C and D) RT-PCR analysis of VEGFA and Vegfa in isogenic OVCAR5 (n = 8) (C) and ID8 (n = 4) (D) cell lines, respectively with or without PARPi treatment. Data are presented as mean ± SEM. p values were computed by a one-way ANOVA test.
(E) Comparison of the immune signature scores (Azizi et al., 2018; Bindea et al., 2013) between ID8Luc Trp53−/−Brca1−/− tumors treated as indicated. Boxplots represent 25th and 75th percentiles, with the midline indicating the median; whiskers extend to the lowest/highest values. p values were computed by ANOVA followed by a Tukey’s post hoc test for multiple comparison correction. *p < 0.05, **p < 0.01.
(F and G) Ex vivo quantification of CD3+ TIL (F) and CD103+ CD3+ TIL frequencies (G) in ID8Luc Trp53−/−Brca1−/− tumors treated with control, PARPis, dual ICB, anti-VEGF-A (aVEGF-A), or their combinations (n = 6–8 per group). All boxplots represent 25th and 75th percentiles, with the midline indicating the median; whiskers extend to the lowest/highest values. Points indicate values for individual subjects. p values were calculated by a Kruskal-Wallis test.
(H and I) RT-PCR analysis of Ccl5 (H) and Ifng and Gzmb (I) expression in ID8Luc Trp53−/−Brca1−/− i.p. tumors treated with the indicated regimen (n = 6–8 per group). All boxplots represent 25th and 75th percentiles, with the midline indicating the median; whiskers extend to the lowest/highest values. Points indicate values for individual subjects. p values were calculated by a Kruskal-Wallis test.
(J) i.p. tumor growth kinetics of ID8Luc Trp53−/−Brca1−/− cancers during treatment with control, olaparib olapaola, dual ICB, αVEGF-A, or their combinations (n = 7–15 per group). p values were calculated by a two-way ANOVA.
See also Figure S7.
