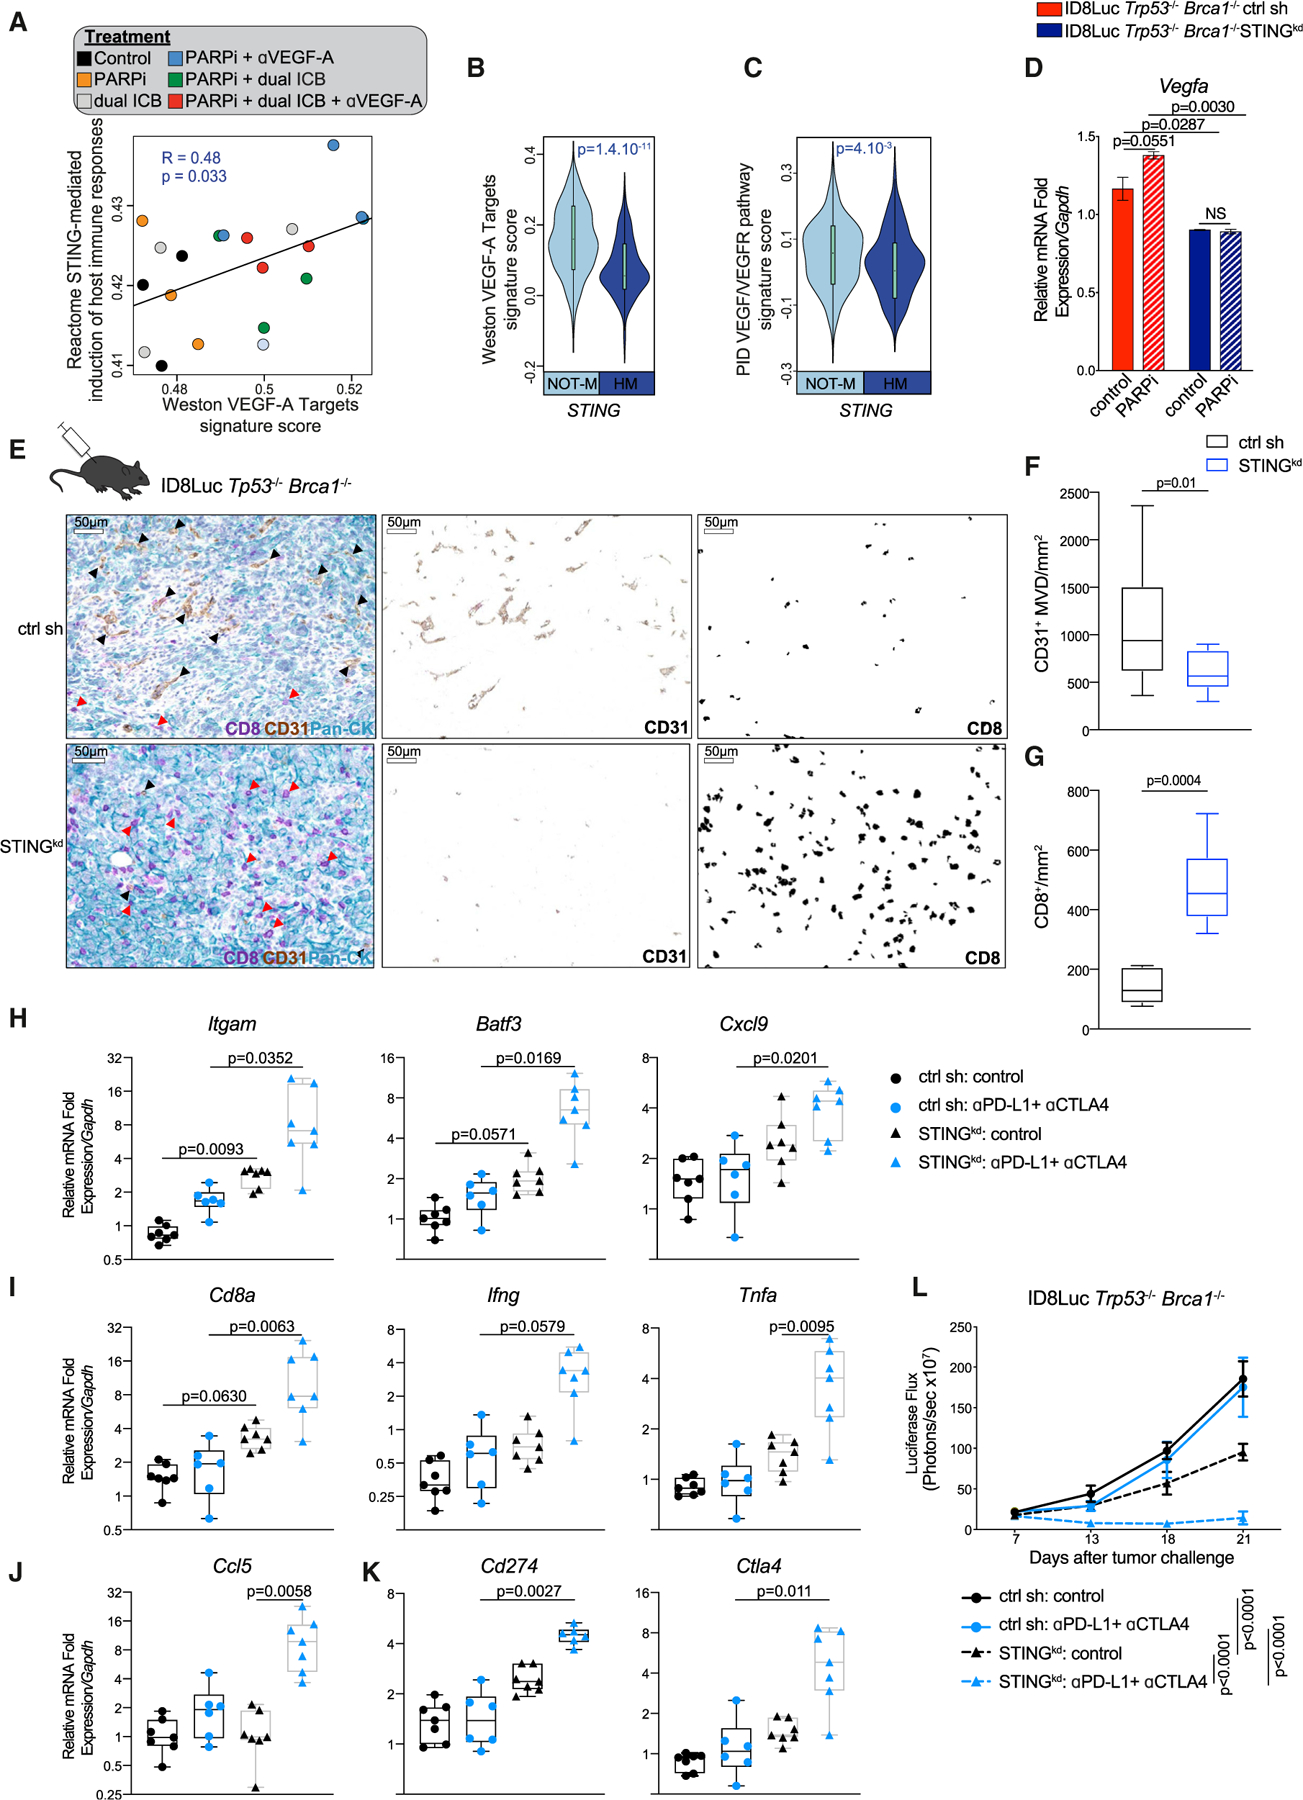
Figure 7. Tumor-intrinsic STING promotes tumor survival and resistance to dual ICB through increased angiogenesis programs in Brca1-deficient tumors.

(A) Scatterplot showing the association between Reactome STING signature score and the Weston VEGF targets signature score in mouse ID8Luc Trp53−/− Brca1−/− tumor RNA sequencing treated with the indicated treatments. Statistical significance was assessed by correlation testing (Pearson).
(B and C) Comparison of the Weston VEGF targets signature score (B) and PID VEGF/VEGFR pathway signature score (Schaefer et al., 2009) (C) between TCGA HGSOCs with (HM) or without STING hypermethylation (Not-M). Violin plots extend to lowest/highest values, and embedded vertical boxes represent the 25th and 75th percentiles. Median is shown by a middle line. Statistical significance was calculated by a Wilcoxon rank-sum tests.
(D) RT-PCR analysis of Vegfa expression in ID8Luc Trp53−/−Brca1−/− STINGkd and scr sh isogenic cell lines 48 h after treatment with PARPi (n = 4). Data are presented as mean ± SEM. p values were calculated by a one-way ANOVA.
(E) Multiplex IHC staining and deconvolution staining for CD8, CD31, and pan-cytokeratin of ID8Luc Trp53−/−Brca1−/− STINGkd and scr sh i.p. tumors. Black arrows show examples of CD31+ vessels, and red arrows show CD8+ T cells. Scale bars, 50 μm.
(F and G) Quantification of CD31+ microvasculature density (F) and CD8+ T cells per mm2 (G) in ID8Luc Trp53−/−Brca1−/− STINGkd (n = 7–14) and scr sh (n = 7–14) i.p. tumors. All boxplots represent 25th and 75th percentiles, with the midline indicating the median; whiskers extend to the lowest/highest values. p values were computed by a Mann-Whitney test.
(H–K) RT-PCR analysis of Itgam (CD11b), Batf3, Cxcl9 (H), Cd8, Ifng, Tnfa (I), Ccl5 (J), Cd274 (PD-L1), and Ctla4 (J) expression in ID8Luc Trp53−/−Brca1−/− STINGkd and scr sh cancers treated with vehicle or dual ICB (n = 7, 6, 7, and 7, respectively). All boxplots represent 25th and 75th percentiles, with the midline indicating the median; whiskers extend to the lowest/highest values. Points indicate values for individual subjects. p values were computed by a Kruskal-Wallis test.
(L) Luciferase-based tumor growth kinetics of ID8Luc Trp53−/−Brca1−/− STINGkd and scr sh cancers treated as indicated (n = 7, 6, 7, and 7, respectively). Data are presented as mean ± SEM. p values were calculated by a two-way ANOVA.
