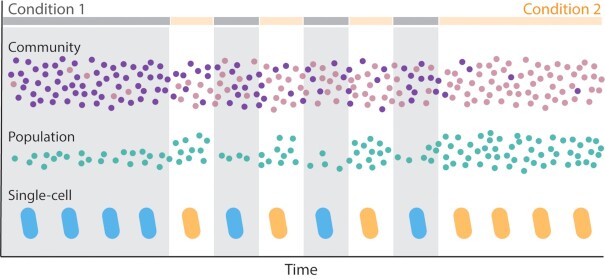
Figure 2.
Community, population and single-cell scales of microbial response to fluctuations. Microbial communities, populations and single cells respond to environmental fluctuations through a variety of processes. A community experiencing fluctuations between Condition 1 and Condition 2 (represented by the broken horizontal gray and orange lines) can shift in community composition between the steady states associated with either condition. The purple species dominates the community when the environment is steadily Condition 1, whereas the pink species dominates under steady Condition 2. The relative abundance of these species fluctuates under fluctuating environmental conditions, as the interactions between species change with the environment. A population can change in size with the environment, as illustrated by the population of green cells, which grows faster in Condition 2 than in Condition 1. Finally, single cells can regulate their physiology in response to the immediate environment. Upon sensing Condition 1, a cell may induce gene expression to produce proteins and metabolites for growth in Condition 1, represented here as a ‘blue’ physiology. Likewise, cells may express genes for an ‘orange’ physiology upon sensing Condition 2.

