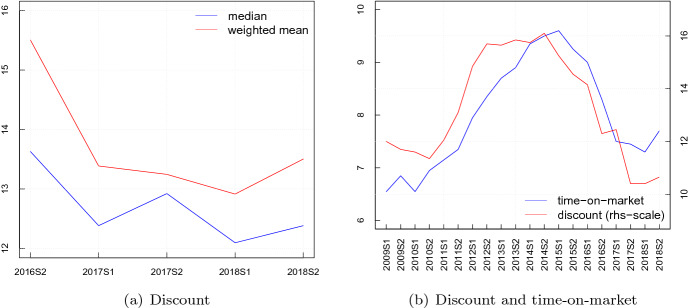
Fig. 3.
Discount applied to listing prices and time-on-market. a Reports the median and the weighted (using housing stocks) average for the discount across OMI microzones (measured in percentage points). The discount is computed as the ratio between the average listing price per s.m. and the average sale price per s.m. minus 1. b Reports the average discount (percentage points) and time-on market (months) in Italy according to the survey on real estate agents

