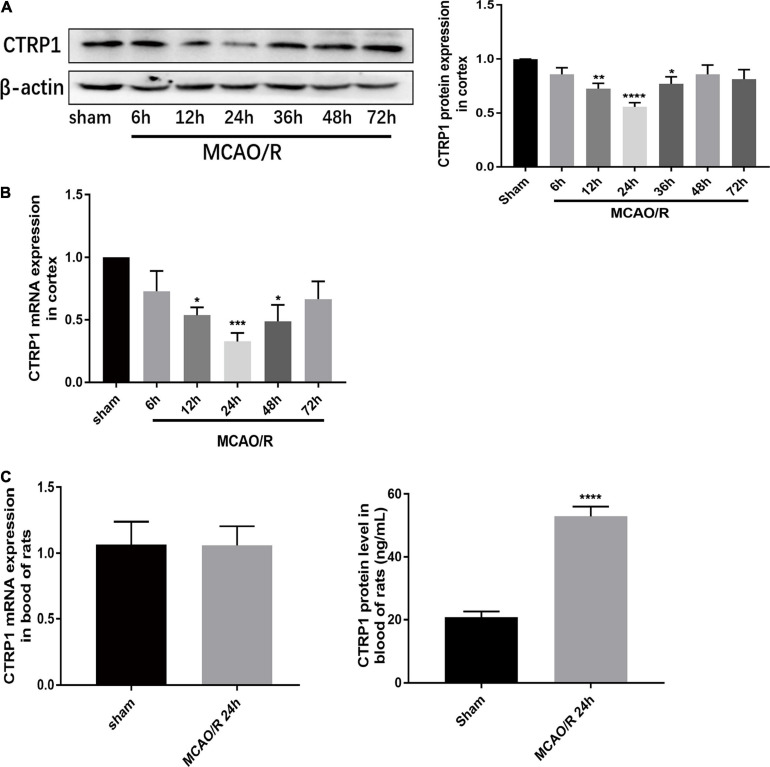
FIGURE 1.
Relative expression of CTRP1 in MCAO/R-treated rats. (A) Relative protein expression of CTRP1 in the cortex detected by Western blot, n = 4 per group. (B) Relative mRNA expression of CTRP1 at different times after MCAO/R in the cortex, n = 4 per group. (C) Relative mRNA expression and concentration of CTRP1 in the serum of MCAO/R rats detected by qRT-PCR and ELISA, n = 12 per group. ****p < 0.0001, ***p < 0.001, **p < 0.001, *p < 0.05 vs. sham group.

