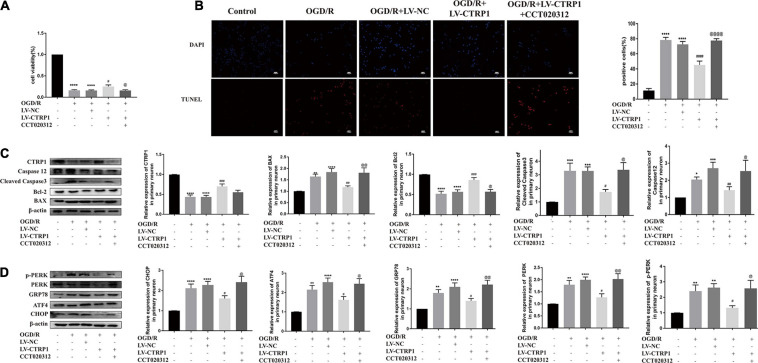
FIGURE 9.
CCT020312 reversed the effect of CTRP1 on apoptosis and the PERK signal pathway after OGD/R. (A) MTT analyzed the cell viability in neurons. n = 4 per group. (B) TUNEL analyzed apoptosis in neurons. n = 3 per group. The representative images were acquired under × 200 magnification, scale bars = 100 μm. (C) The expression of CTRP1, BAX, Bcl-2, Cleaved caspase 3, Caspase 12 was analyzed by Western blot. n = 4 per group. (D) The relative expression of CHOP, GRP78, ATF4, PERK and p-PERK in neurons. n = 4 per group. ****p < 0.0001, ***p < 0.001, **p < 0.01, *p < 0.05 vs. control group, ####p < 0.0001, ###p < 0.001, ##p < 0.01, #p < 0.05 vs. OGD/R + LV-NC group, @@@@p < 0.0001, @@ p < 0.01, @ p < 0.05 vs. OGD/R + LV-CTRP1 group.

