
FIGURE 2.
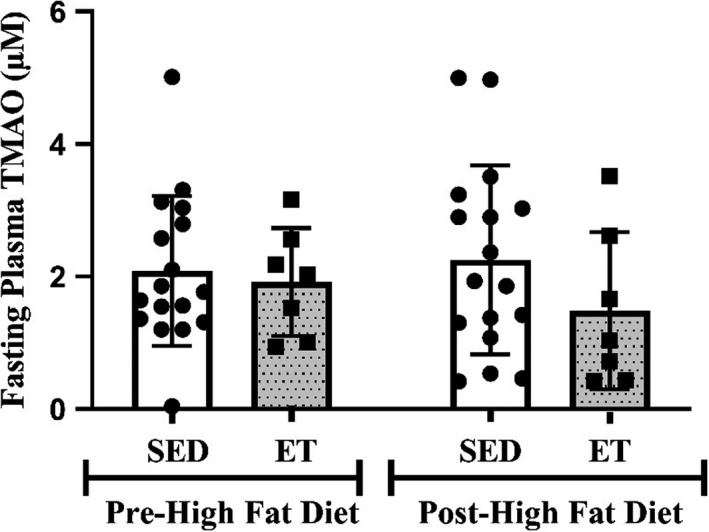
Fasting plasma TMAO concentration in SED and ET before and followeing the high‐fat diet. Values are expressed as mean ± SD. ET, endurance‐trained group; SED, sedentary group; TMAO, trimethylamine N‐oxide
Official websites use .gov
A
.gov website belongs to an official
government organization in the United States.
Secure .gov websites use HTTPS
A lock (
) or https:// means you've safely
connected to the .gov website. Share sensitive
information only on official, secure websites.
Fasting plasma TMAO concentration in SED and ET before and followeing the high‐fat diet. Values are expressed as mean ± SD. ET, endurance‐trained group; SED, sedentary group; TMAO, trimethylamine N‐oxide