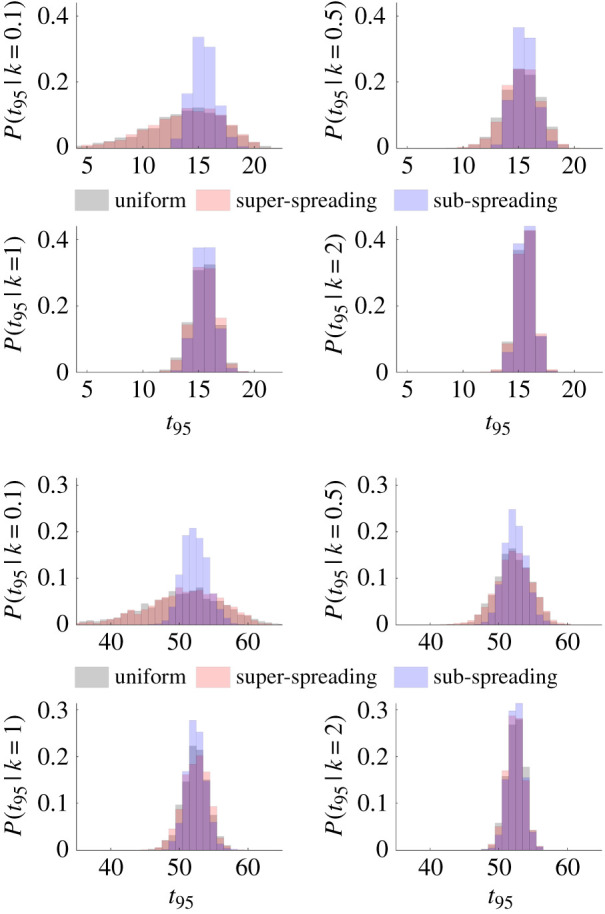
Figure 7.

Declaration times for different epidemics. We generate 2000 future trajectories of zero case-days using empirical incidence data of the SARS epidemic in Hong Kong in 2003 (top) [22] and simulated incidence for EVD (bottom) from [33]. We obtain trajectories by sampling from the future reproduction number, , distributions for uniform, super-spreading and sub-spreading control measures and plot corresponding 95% declaration times (t95). The uniform and super-spreading results largely overlap. All times are relative to that of the last observed case and assume a mean controlled reproduction number of ρμ = 0.5. As in the main text, we see that sub-spreading control is most effective at reducing the variability (increasing the reliability) of end-of-epidemic declarations.
