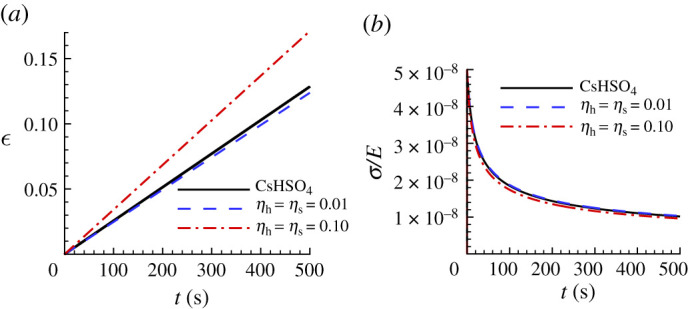
Figure 14.

Uniaxial creep and stress relaxation responses using the averaged predicted parameter values over 100 realizations for obtained with noise-contaminated HTS data in table 6. The solid lines show the corresponding ‘experimental’ responses. (a) Uniaxial logarithmic strain, , versus time . (b) Normalized uniaxial Cauchy stress, , versus time, . On the scales in (b), the prediction with is indistinguishable from the corresponding ‘experimental’ response.
