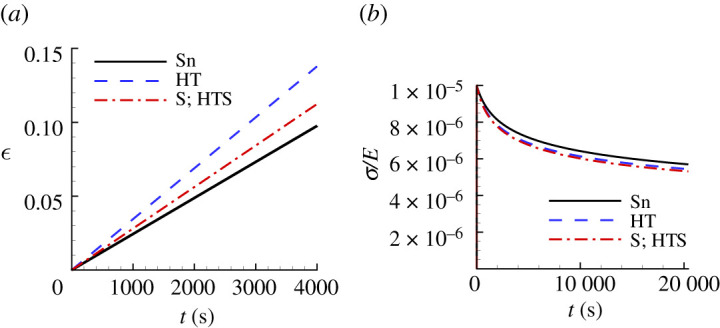
Figure 9.

Comparison of the predicted uniaxial creep and stress relaxation responses using the parameter values in table 4 with the corresponding ‘experimental’ responses for Sn. See the caption of figure 6 for the meanings of HT, S and HTS. (a) Uniaxial logarithmic strain, , versus time, . (b) Normalized uniaxial Cauchy stress, , versus time, .
