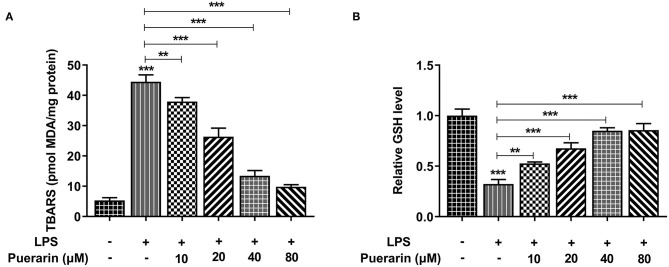
Figure 3.
Pue alleviated lipid peroxidation of LPS-induced A549 cells. (A) The TBARS production rate was detected by TBARS quantitative kit in LPS-induced cells when different condition of Pue induced. (B) The GSH production rate was detected by GSH quantitative kit in LPS-induced cells when different condition of Pue induced. N = 5. **P < 0.01 and ***P < 0.001.

