FIGURE 2.
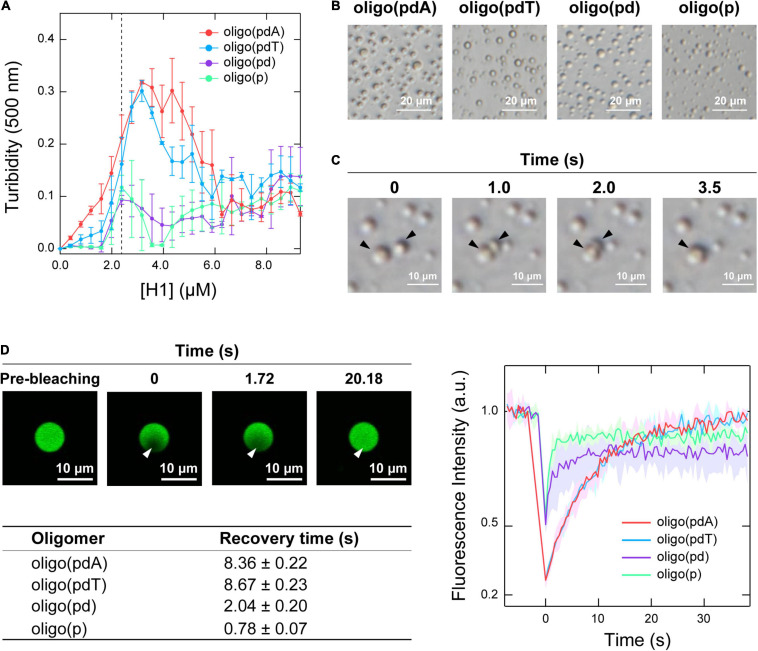
LLPS of mixtures of the oligomers and H1. (A) Turbidimetric titration curves of H1 against solutions containing 5.0 μM of the oligomers. (B) Phase-contrast microscopy images of the solutions under the conditions indicated by the dotted line in panel A (5.0 μM oligomer and 2.5 μM H1); scale bar = 20 μm. (C) Fusion process of the spherical assemblies formed by oligo(pdA) (5.0 μM) and H1 (2.5 μM); scale bar = 10 μm. (D) Left: confocal fluorescence microscopy images during FRAP measurements. White arrowhead indicates the bleached area; scale bar = 10 μm. Right: FRAP recovery curves for the oligomers; values shown represent mean values ± standard deviation (n = 3). The table below lists the fluorescence-recovery times calculated by single-exponential fitting. All experiments were carried out in 10 mM Tris-EDTA buffer (pH = 7.4).

