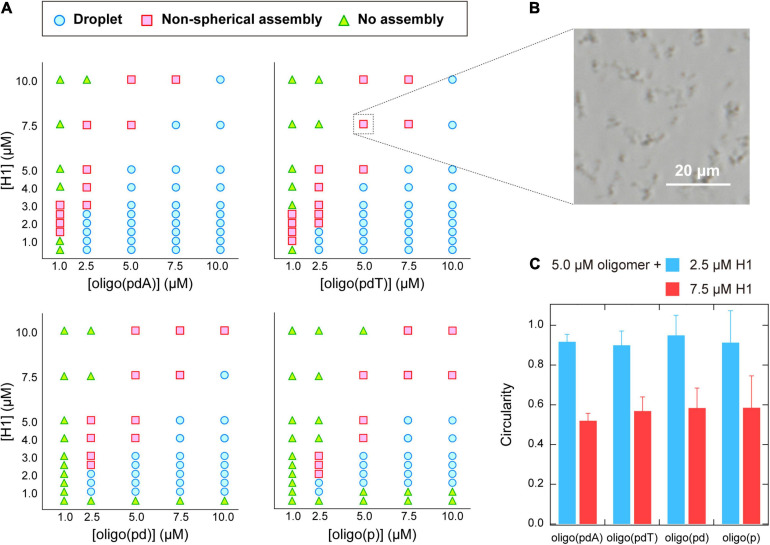
FIGURE 3.
(A) Phase diagrams of aqueous mixtures of oligomers and H1. (B) Phase-contrast microscopy image of typical non-spherical assemblies; 5.0 μM poly(pdT) and 7.5 μM H1; scale bar = 20 μm. (C) Circularity of the assemblies formed in solutions containing 5.0 μM oligomer and 2.5 or 7.5 μM H1. The values were obtained by analyzing the fluorescence microscopy images of the solutions under the indicated conditions using the image processing software image J.

