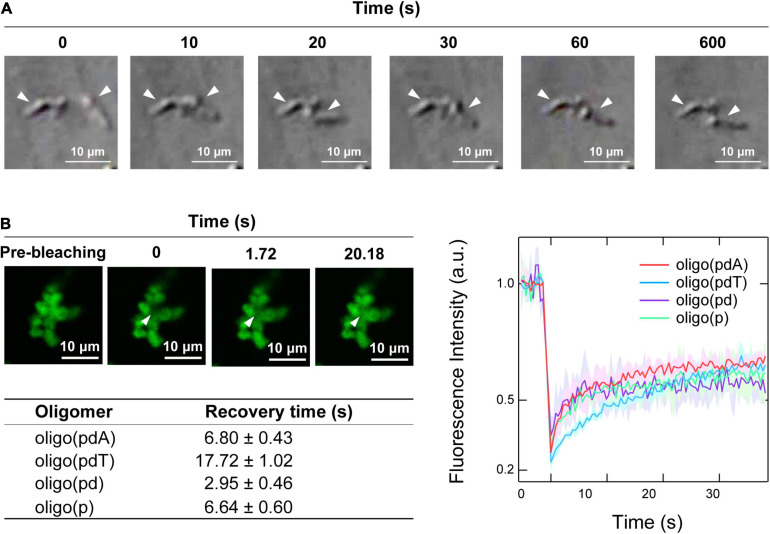
FIGURE 4.
Physical properties of the non-spherical assemblies. (A) Collision process of the non-spherical assemblies formed by oligo(pdA) (5.0 μM) and H1 (7.5 μM); scale bar = 10 μm. (B) Left: confocal fluorescence microscopy images during the FRAP measurements. White arrowheads indicate the bleached areas; scale bar = 10 μm. Right: FRAP recovery curves for the oligomers; values shown represent mean values ± standard deviation (n = 3). The table below lists the fluorescence-recovery times calculated by single-exponential fitting.

