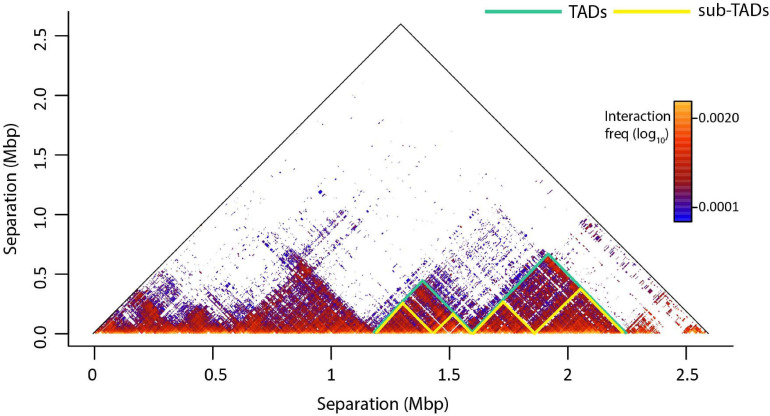
FIGURE 2.
An example of genome architecture: TADs and sub-TADs. T2C interaction frequencies are displayed as a two-dimensional heatmap, where intra-TAD contacts (in fact proximities) are more frequent than inter-TAD contacts. TADs confine cis-regulatory elements and target gene promoters in space like two elements tethered on a string. This facilitates regulatory interactions within the TAD and prevents unwanted regulatory activity across TAD regions. Sub-TADs and TADs are depicted with yellow and green lines, respectively.

