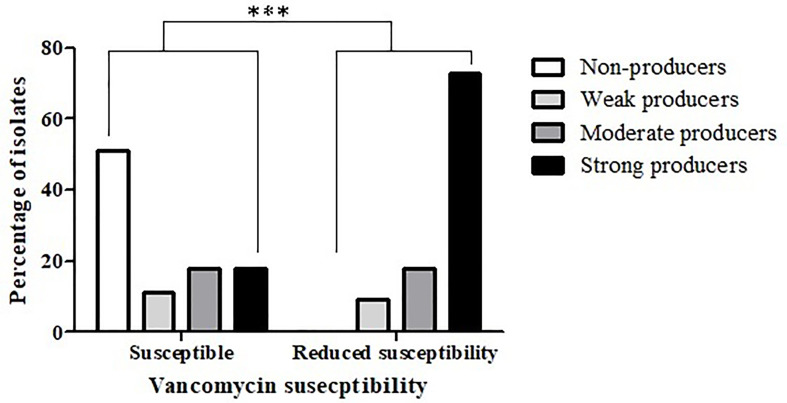
Figure 3.
Biofilm production capacity among isolates that are vancomycin-susceptible and isolates with reduced vancomycin- susceptibility. The biofilm-production capacity of C. difficile isolates was compared between isolates that are vancomycin-susceptible (n = 112) and isolates with reduced vancomycin susceptibility (n = 11) isolates (***p < 0.0001). The p value represents the comparison of the biofilm production capacity between susceptible isolates and isolates with reduced susceptibility (Chi square analysis).

