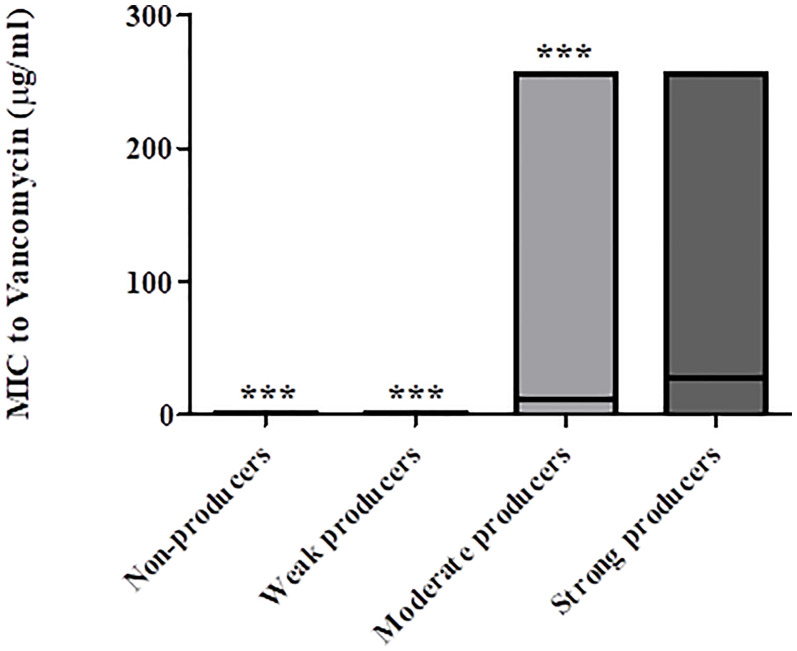
Figure 4.
Distribution of vancomycin MIC values of non-biofilm producers, weak-, moderate- and strong biofilm producers. The minimal, maximal and average MIC values are shown (the average is indicated by the line within the bar) for each group of isolates (non-producers, weak-, moderate- and strong producers’ groups). The mean vancomycin MIC of strong biofilm producers (n = 29) were significantly higher as compared to MIC values of isolates that were non-producers (n = 57), weak producers (n = 14) and moderate producers (n = 23), ***p < 0.001. The p value represents the comparison of the mean MIC between the four categories of biofilm production capacity (ANOVA analysis).

