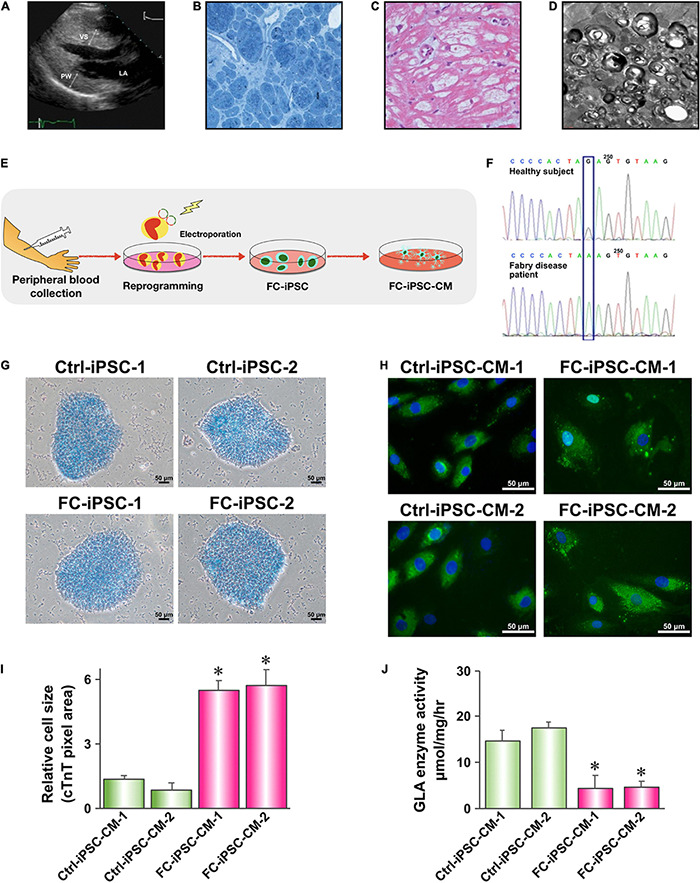
FIGURE 2.

Generation and characterization of Fabry disease patient-specific iPSC-derived cardiomyocytes. (A) Transthoracic echocardiogram demonstrating marked ventricular septum (VS) and posterior wall (PW) hypertrophy of the left ventricle. (B) H&E staining of a myocardial biopsy sample showing markedly hypertrophic and disorganized myocytes with large perinuclear and sarcoplasmic vacuoles. (C) Toluidine blue staining of a myocardial biopsy sample showing accumulation of glycosphingolipids. (D) Transmission electron microscopy (TEM) image of a myocardial biopsy sample showing lamellar bodies (zebra bodies) representing lysosomes containing glycolipids. Magnification 60,000×. (E) Schematic outline of experimental approach to generate Fabry disease patient-specific iPSC-derived cardiomyocytes. (F) Sanger sequencing confirming the presence of IVS4 + 919 G > A mutation in FC-iPSC cell line. (G) Alkaline phosphatase staining of Ctrl-iPSC and FC-iPSC clones. (H) Immunofluorescent staining of cardiac troponin T (cTnT) in Ctrl-iPSC-CM and FC-iPSC-CM clones at post-induction day 60. (I) Quantification of area size of Ctrl-iPSC-CM and FC-iPSC-CM clones. (J) Quantification of GLA enzymatic activity in Ctrl-iPSC-CM and FC-iPSC-CM clones. In (I,J) mean values from three independent experiments are show with standard deviation error bars, ∗p < 0.01 (Student’s t-test).
