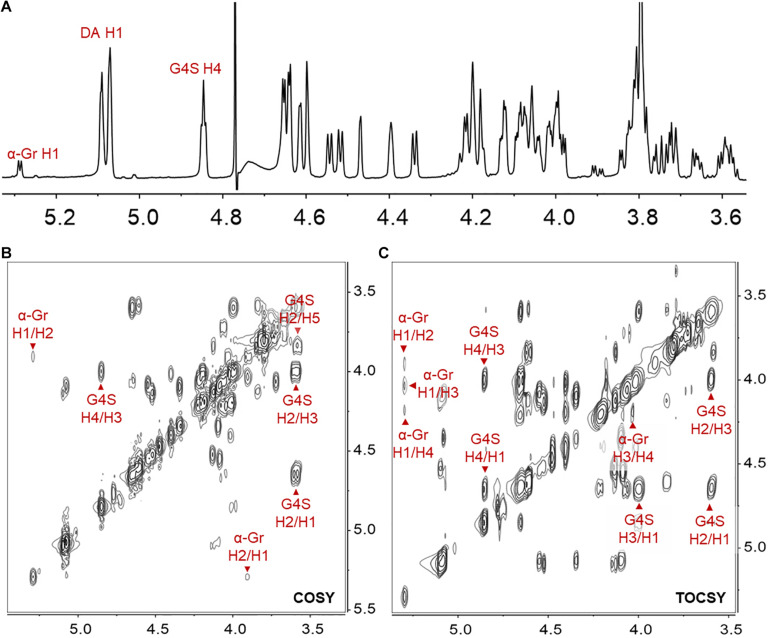
FIGURE 7.
The 1H NMR (A), COSY (B), and TOCSY (C) spectra of the hexasaccharide (DA-G4S)2(DA-G)1 purified from the final product. The axes are 1H chemical shifts (ppm). The α-Gr indicated the α-G residue located at the reducing end; H1/H2 indicated the cross-peak between H-1 and H-2, etc. The 1H NMR, COSY, and TOCSY spectra of another hexasaccharide component (DA-G4S)1(DA-G)2 are found in Supplementary Figure 3.

