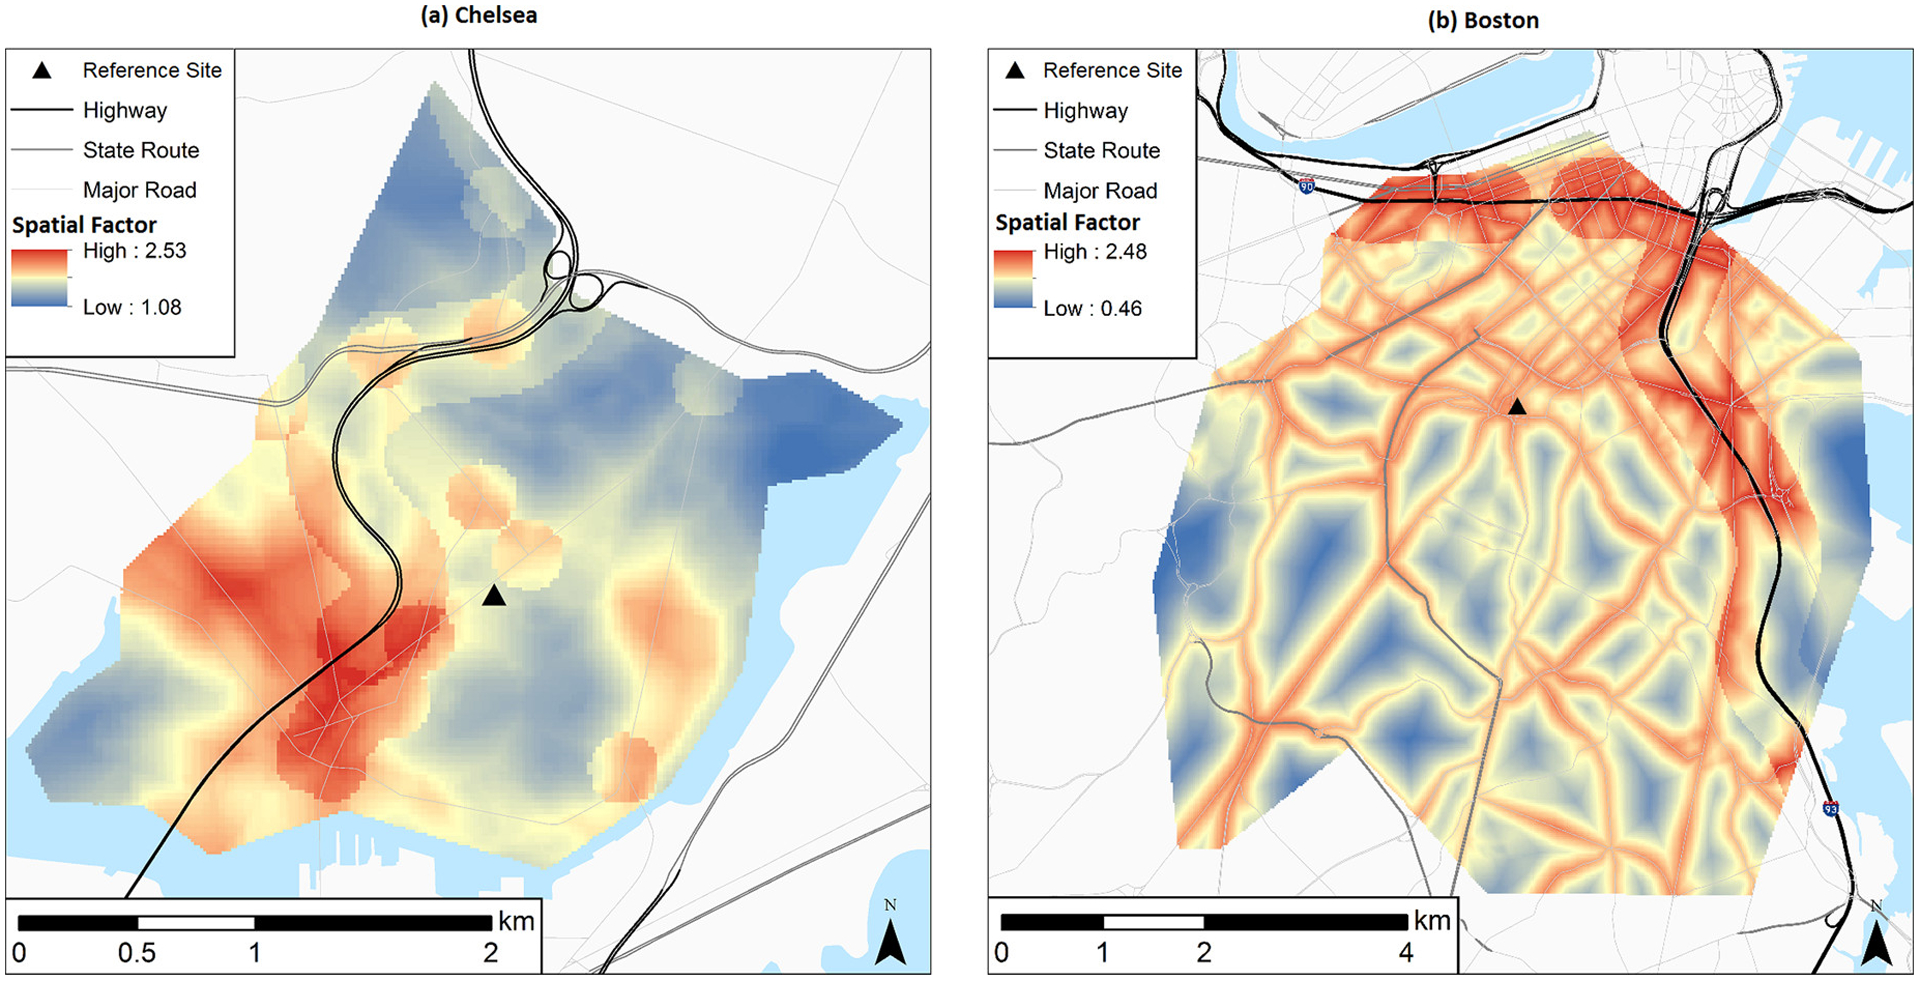
Figure 2.

Predicted spatial factor values (20 m × 20 m grid) for the (a) Chelsea and (b) Boston study areas; spatial factor values range from 1.08 to 2.53 in Chelsea and 0.46 to 2.48 in Boston. Predicted values are based on the models described in Table 2.
