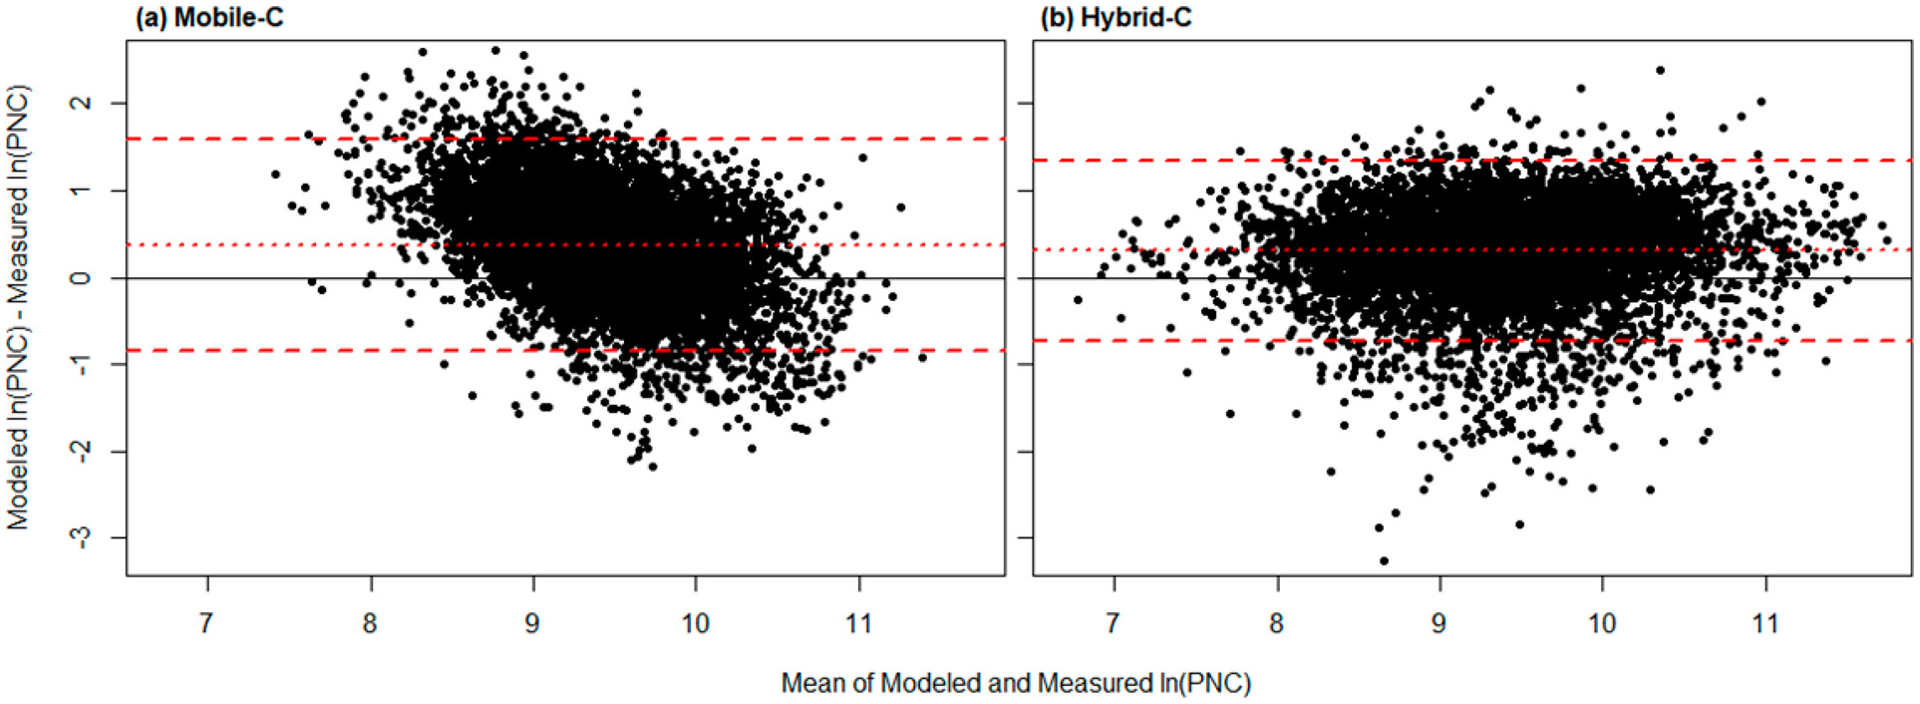
Figure 4.

Bland-Altman plot comparing modeled to measured hourly ln(PNC) at all residential sites in the Chelsea study area using (a) Mobile-C and (b) Hybrid-C. The y-axis represents the difference between hourly modeled and measured ln(PNC), and the x-axis represents the mean of hourly modeled and measured ln(PNC). Mean differences (dotted red lines) indicate systematic positive differences of modeled ln(PNC) relative to measured ln(PNC). The solid black (reference) line represents a mean difference of zero. Outer dashed red lines represent ± two standard deviations from the mean difference.
