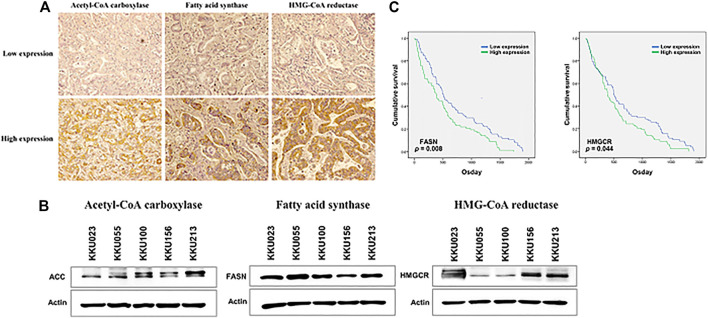
FIGURE 1.
The expression of lipid-metabolizing enzyme in CCA tissues and cell lines. (A) Immunohistochemical staining of ACC, FASN and HMGCR using a human CCA tissues microarray; low expression is shown in the upper panel and high expression in the lower panel. (B) ACC, FASN and HMGCR protein expression in five CCA cell lines using western blot analysis. (C) The Kaplan-Meier survival curves of CCA patients were examined according to lipid-metabolizing enzymes expression; the p-values were calculated by the log-rank test.

