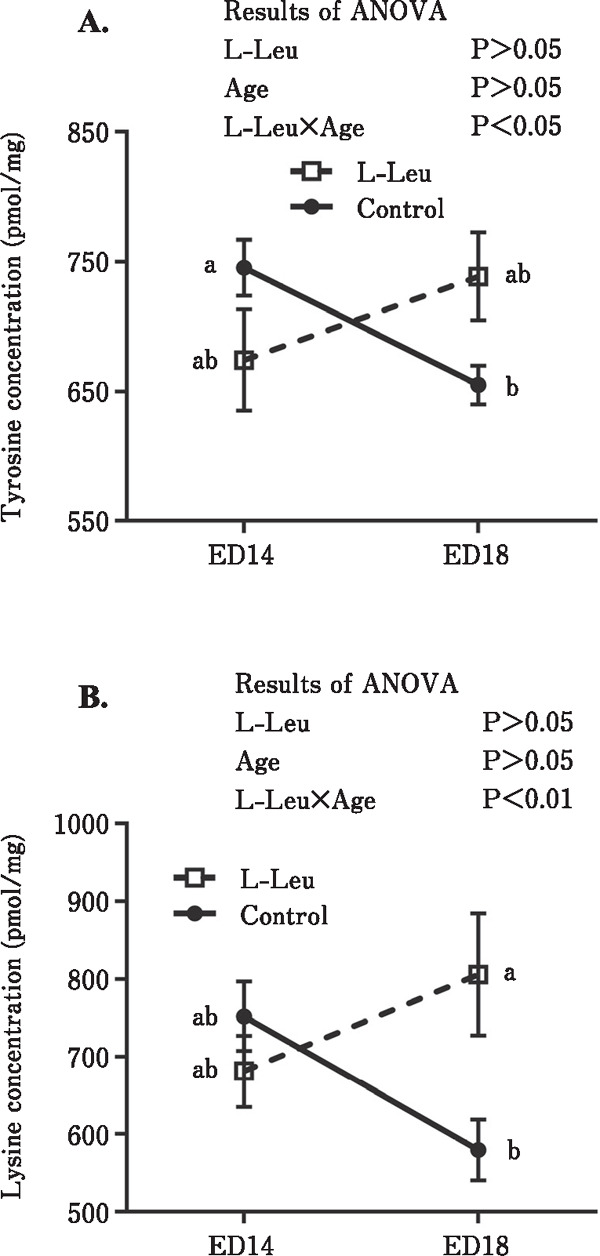
Fig. 4.

Effects of L-Leu in ovo injection on tyrosine (A) and lysine (B) concentration changes in the liver of chick embryos. The number of chick embryos in each group was n=6. Values are represented as mean±SEM. Different letters beside the symbols indicate significant (P<0.05) differences. L-Leu, L-leucine; ED, embryonic day.
