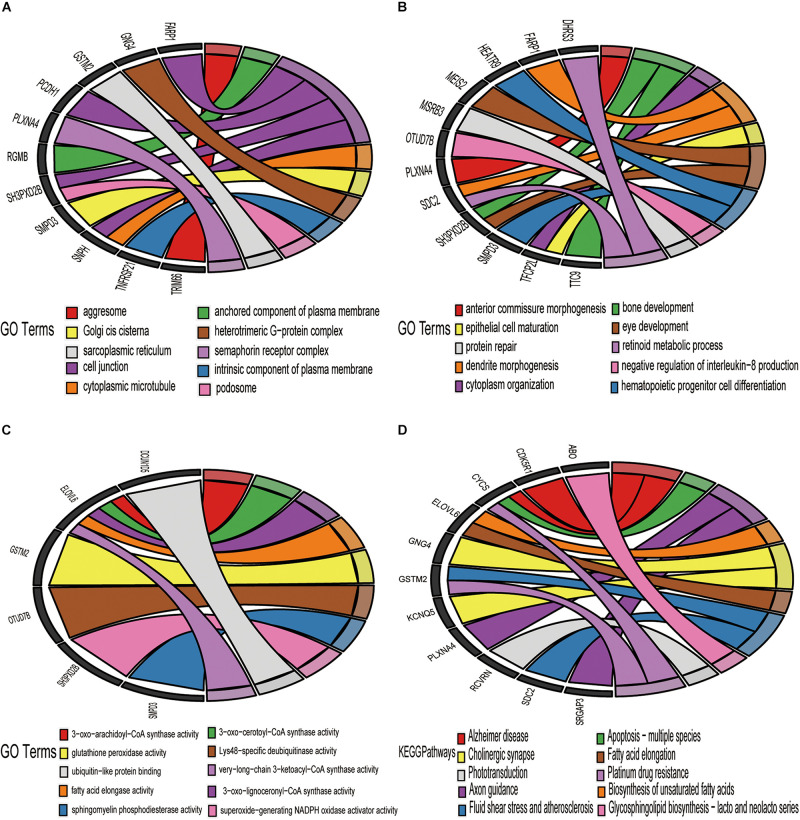
FIGURE 7.
Enrichment analysis of 44 downregulated target DE-mRNAs. Chord plots was used to visualize the enrichment analysis of these DE-mRNAs. (A) GO item cellular CC analysis. (B) GO item Bp analysis. (C) GO item MF analysis. (D) KEGG pathway analysis. The thresholds were a | log2FC| ≥ 0.58 and P-value ≤ 0.05.

