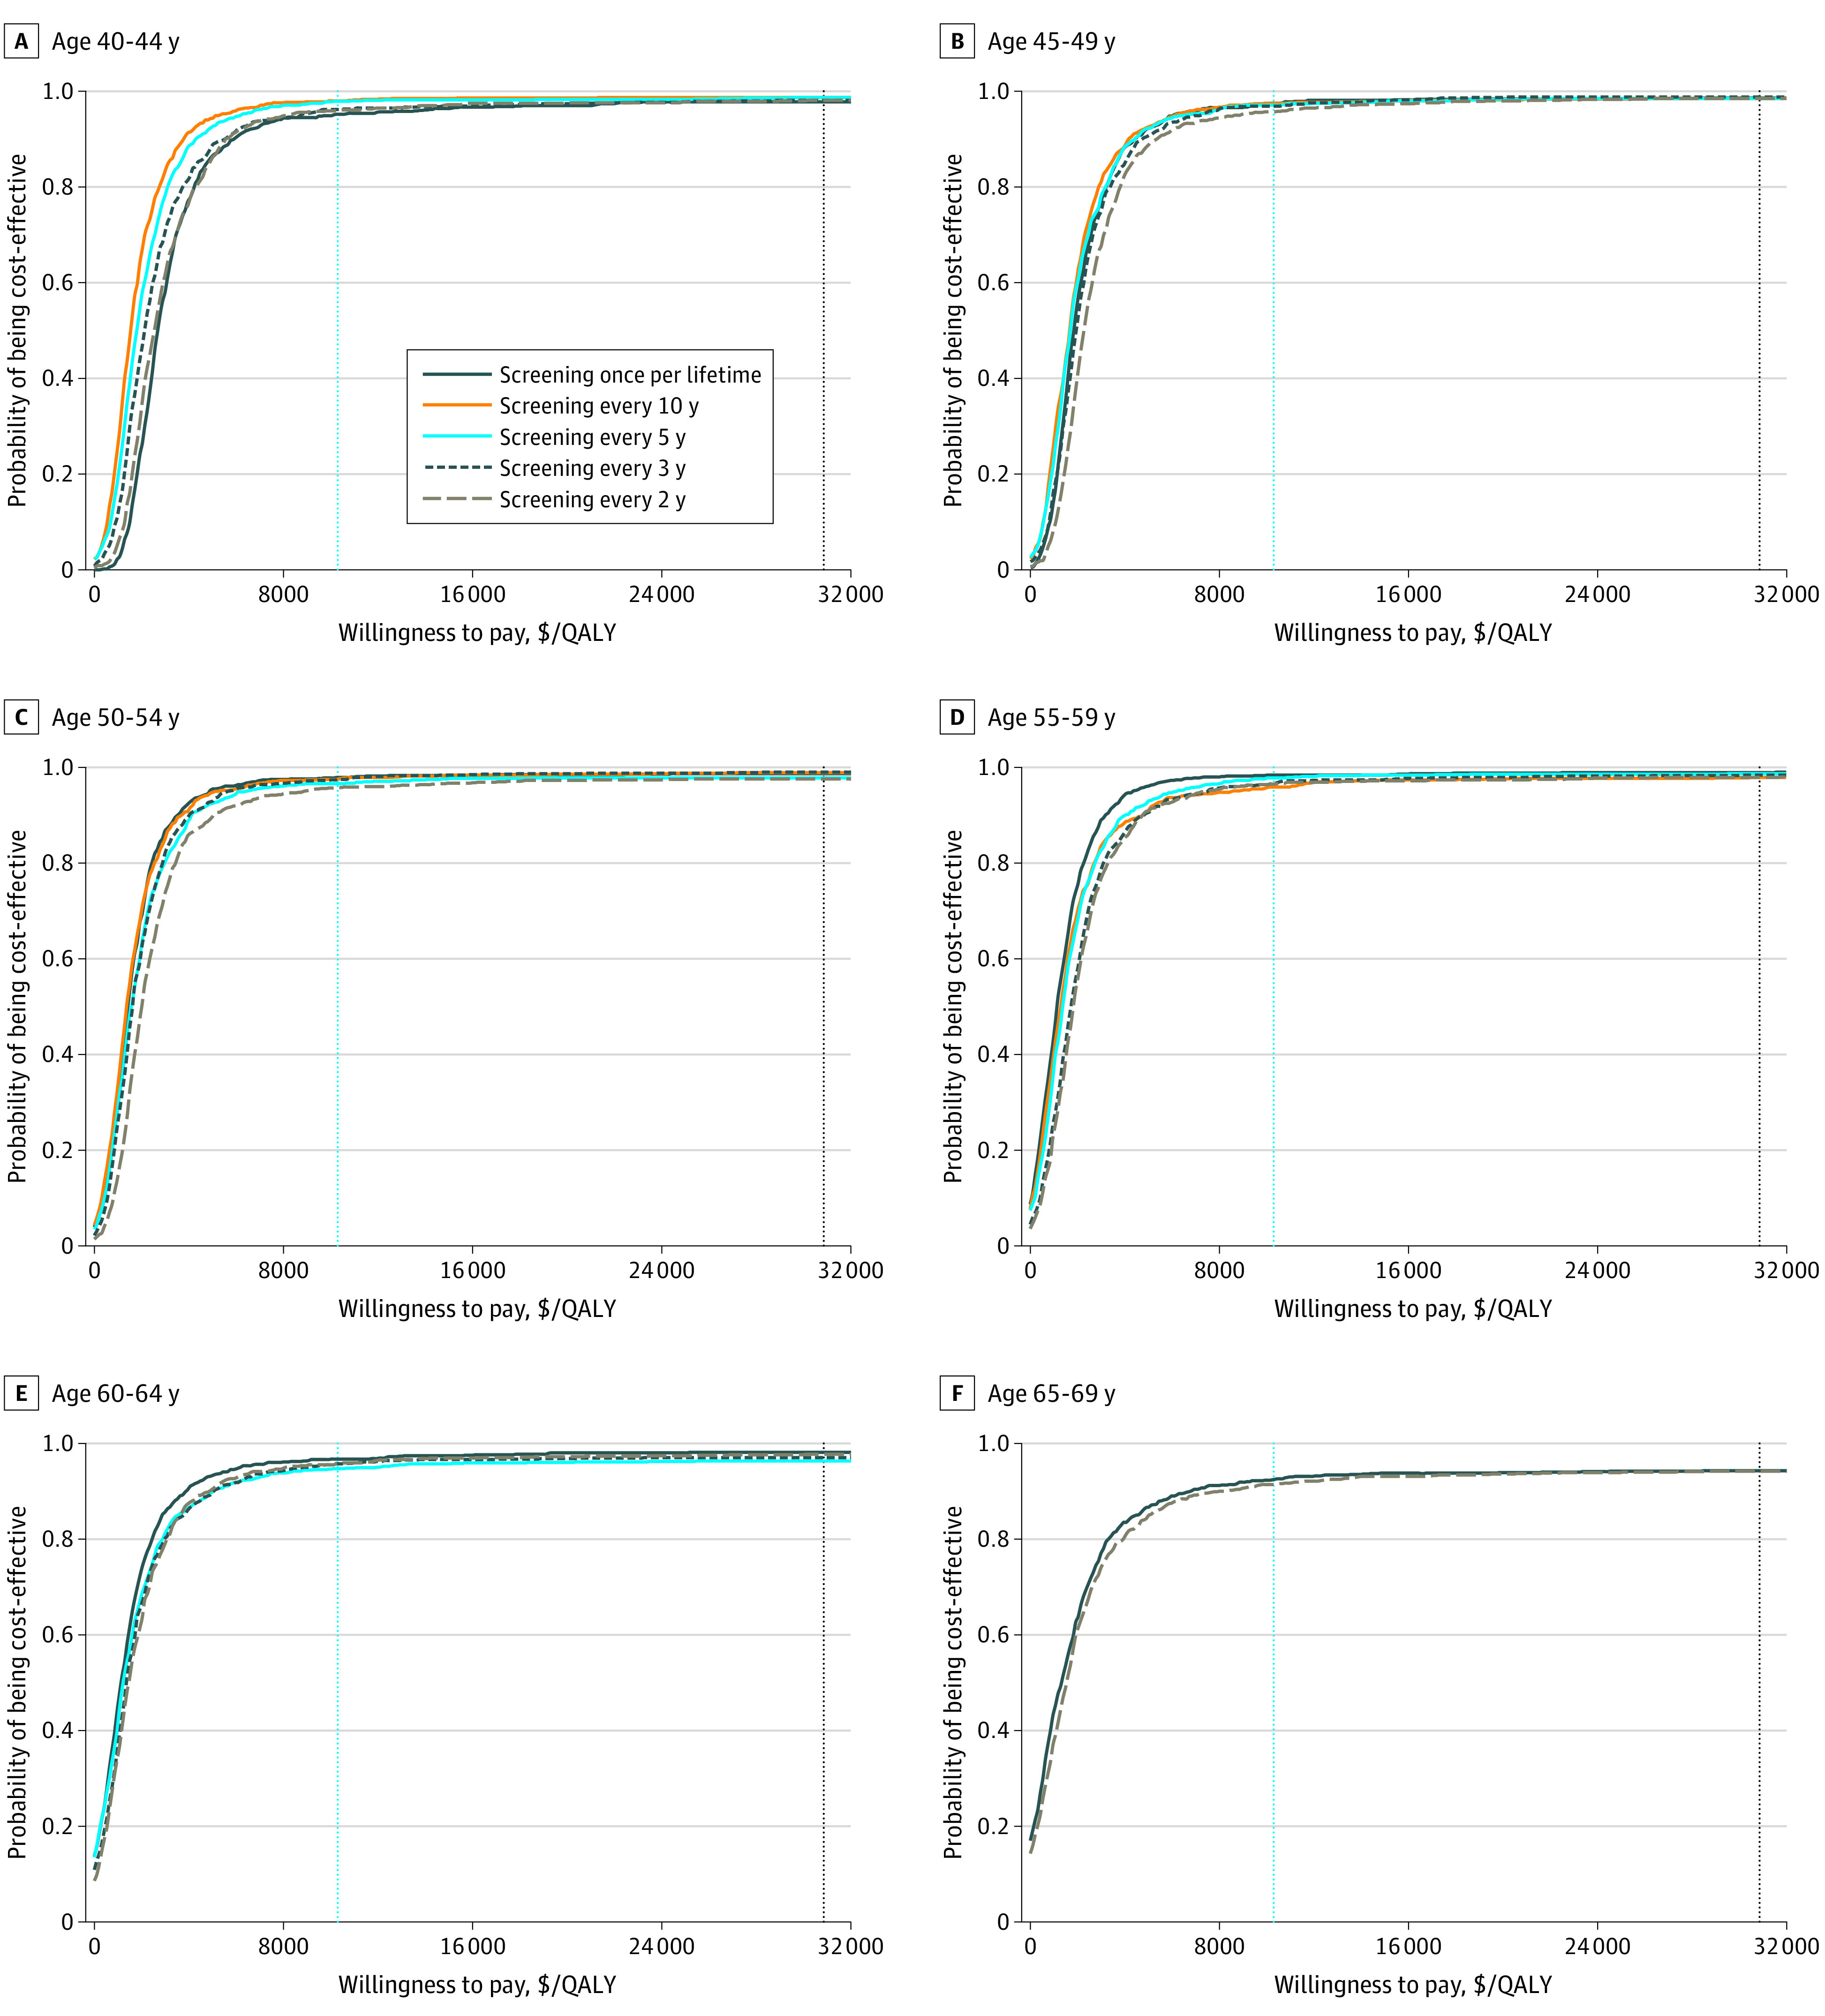
Figure 1. Cost-effectiveness Acceptability Curves of All Screening Strategies Compared With No Screening by Initial Screening Age.

Dashed vertical blue lines represent per capita gross domestic product (GDP); dashed vertical black lines represent 3 times per capita GDP. QALY indicates quality-adjusted life-year.
