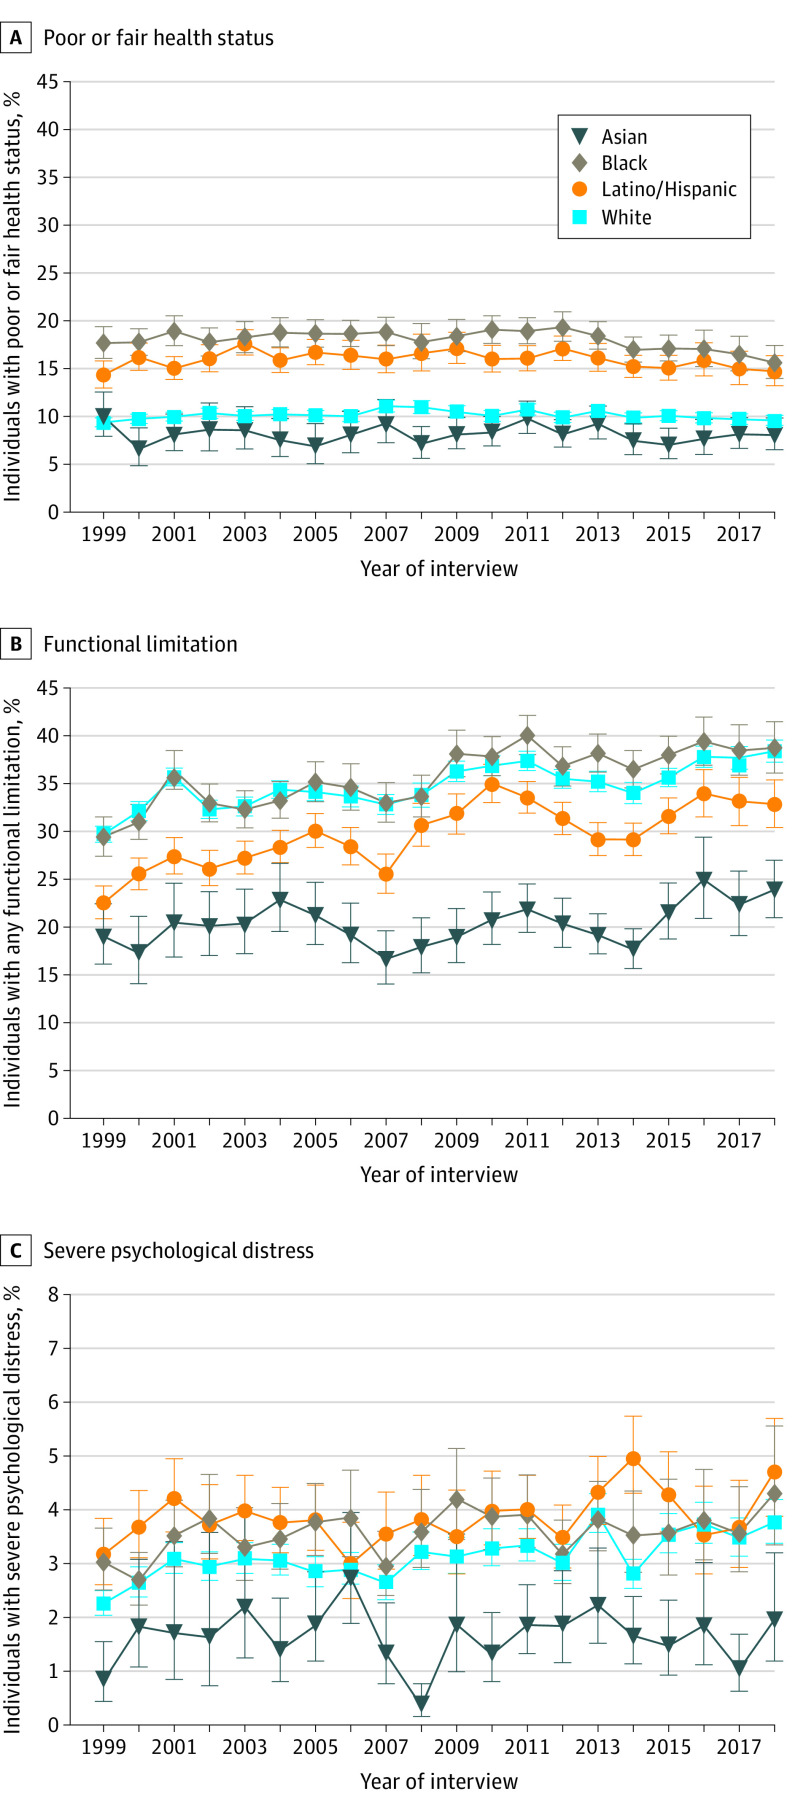
Figure 2. Trends of Self-reported Poor or Fair Health Status, Functional Limitation, and Severe Psychological Distress by Race and Ethnicity, 1999-2018.
Data source is the National Health Interview Survey from years 1999 to 2018. Rates are adjusted for age, sex, and US region using logistic regression, with 95% CIs shown with error bars. Definitions of each outcome are shown in Study Outcomes in the Methods section. The median annual number of adults included in the study by race and ethnicity were 1301 (IQR, 911-1815) non-Hispanic Asian, 4355 (IQR, 3843-4589) non-Hispanic Black, 5325 (IQR, 4212-5603) Latino/Hispanic, and 20 290 (IQR, 16919-20961) non-Hispanic White. The annual number and weighted proportion of individuals included in the study population are shown in eFigure 1 in the Supplement. The income-stratified results for these measures are presented in eFigure 4 in the Supplement.

