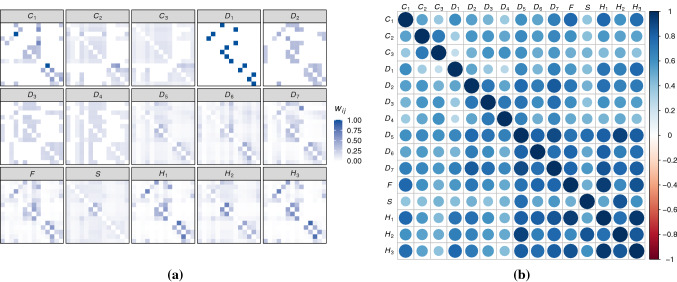
Fig. 3.
Graphical description of the main fifteen neighborhood matrices (of size ) considered for the comparative analysis a. The entries of the matrices () have been row-normalized to allow for comparison ( always lies between 0 and 1). The correlation between each pair of matrices, computed as the correlation between the vectorizations of the matrices, are shown in b

