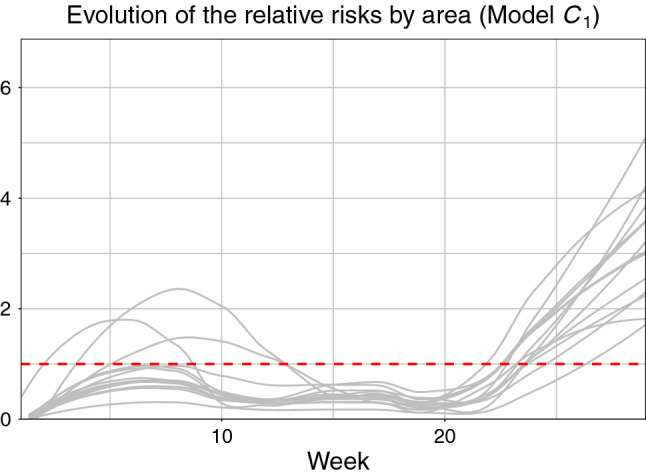
Fig. 8.

Evolution of the relative risks (), according to the estimates provided by Model in the fourteen areas under analysis. The relative risks have been smoothed through a locally estimated scatterplot smoothing (LOESS) regression (Fox and Weisberg 2018) for ease of visualisation. The red dashed line represents a relative risk of 1
