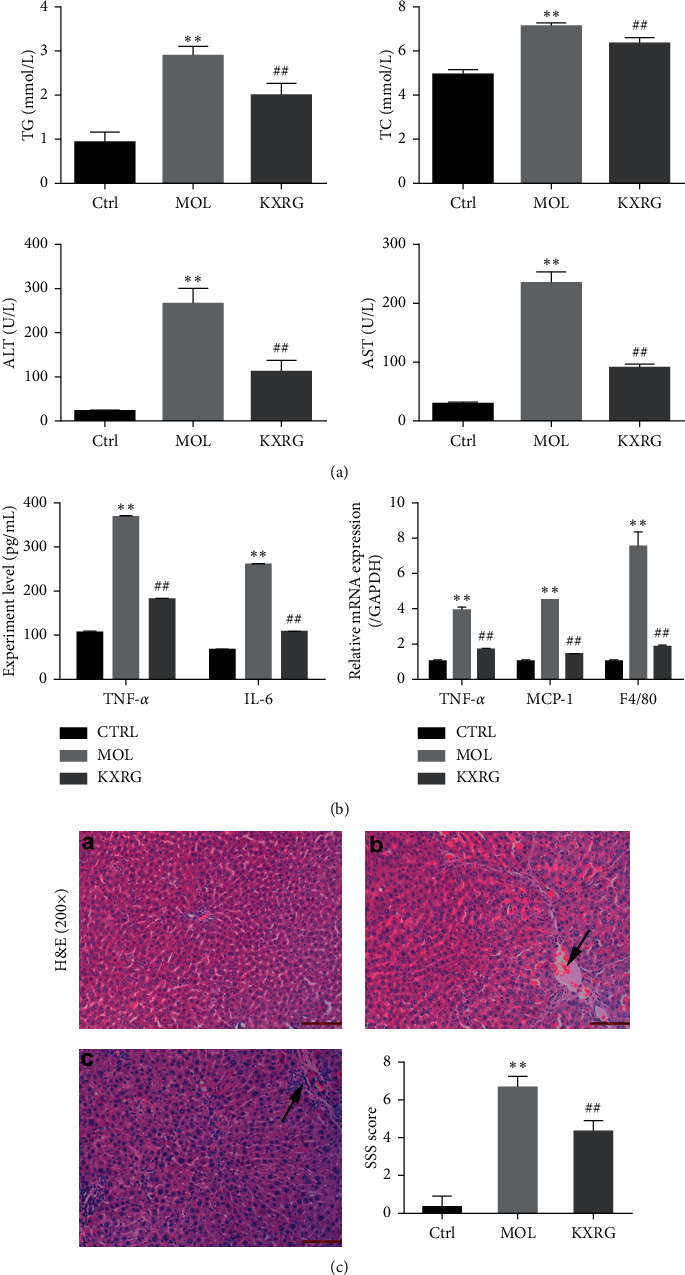
Figure 1.

Effect of KXRG on inflammatory cytokines in serum and histopathological changes in liver. CTRL: Control; MOL: Model; KXRG: Kangxian ruangan. (a) Level of TG, TC, ALT and AST, (b) Level of TNF-α and IL-6, and mRNA expression of TNF-α, MCP-1 and F4/80; (c) Liver histopathological changes and SSS score; (a) Control; (b) Model; (c) KXRG. The results are presented as the mean ± SD (n = 8 per group). ∗∗p < 0.01 compared with CTRL; ##p < 0.01 compared with MOL. The scale bar is 50 μM (magnification: 200×).
