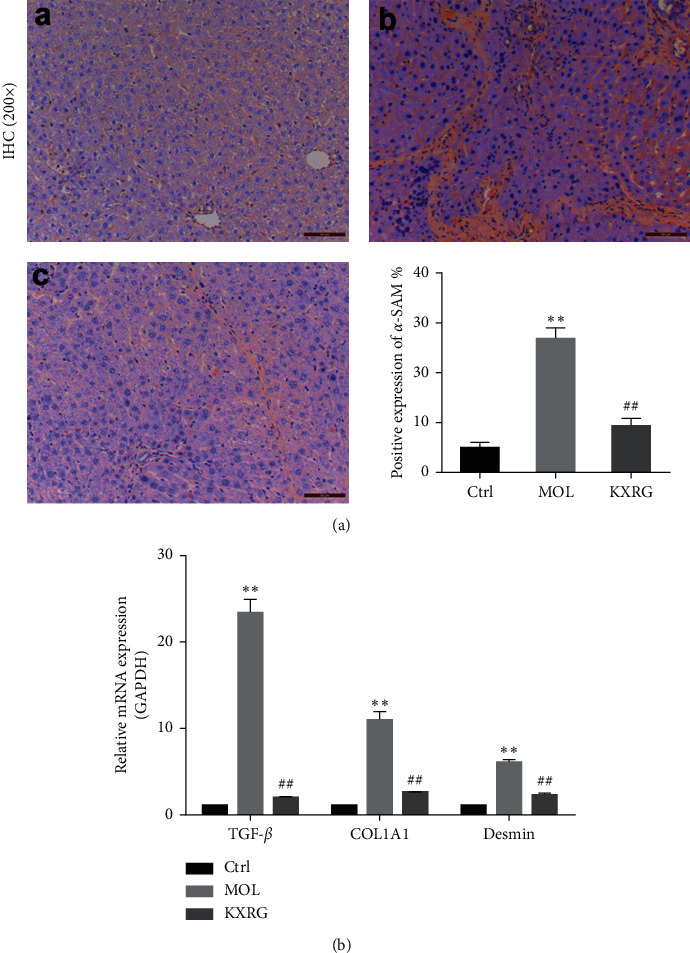
Figure 2.

KXRG reduced the expression of α-SMA in the liver. CTRL: Control; MOL: Model; KXRG: Kangxian ruangan. (a) Immunohistochemical staining and statistical analysis of the positive expression of α-SMA; (b) mRNA expression of TGF-β, COL1A1, and Desmin. (a) Control; (b) Model; (c) KXRG. ∗∗p < 0.01 compared with CTRL; ##p < 0.01 compared with MOL. The scale bar is 50 μM (magnification: 200×).
