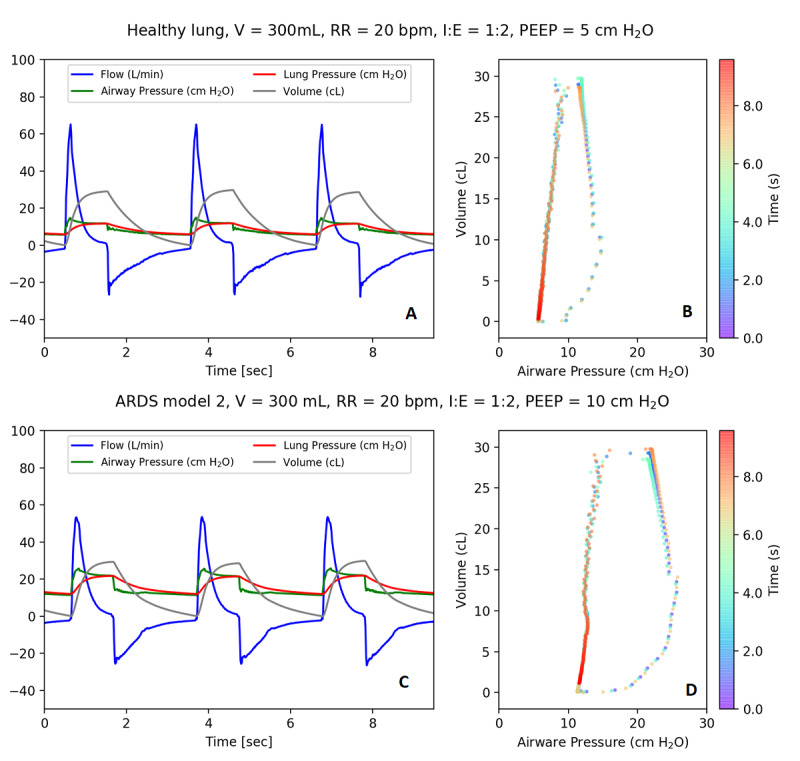
Figure 6.

Example waveforms. (A) Ventilator connected to the simulator and (B) pressure–volume curve over time for healthy lung model and (C) ventilator connected to the simulator and (D) pressure–volume curve over time for with an acute respiratory distress syndrome 2 lung model. In A and C, flow is shown in blue, pressures are shown in red and green, and volume is shown in gray. ARDS: acute respiratory distress syndrome; I:E: inspiratory-to-expiratory ratio; PEEP: positive end-expiratory pressure; RR: respiratory rate; V: volume.
