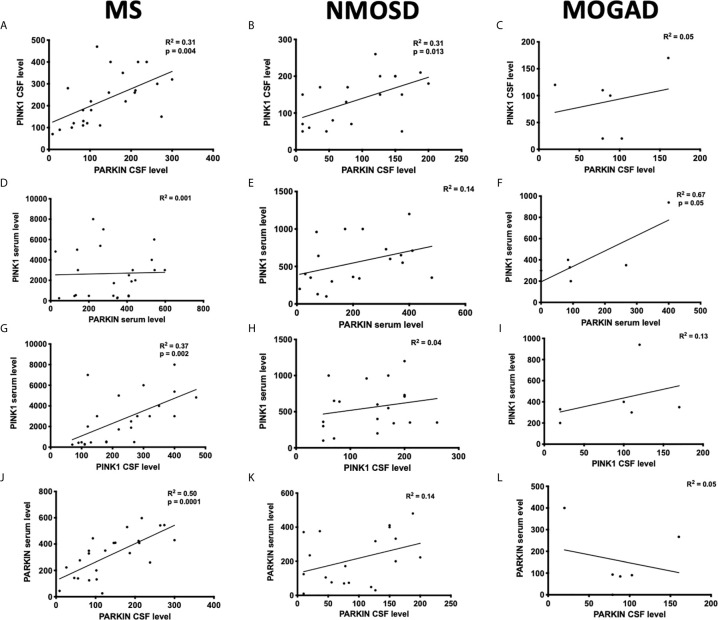
Figure 2.
Correlation between PINK1 and PARKIN proteins in the serum and CSF of patients. The distributions represent correlation between the protein concentrations detected in the serum (A–C) or CSF (D–F) of patients with MS, NMOSD, and MOGAD. Correlation between CSF and serum PINK1 (G–I) and PARKIN (J–L) in the patients with MS, NMOSD, and MOGAD. Each circle represents the titer for one patient. Pearson’s correlation coefficient. P ≤ 0.05 was considered statistically significant.

