
Figure 3.
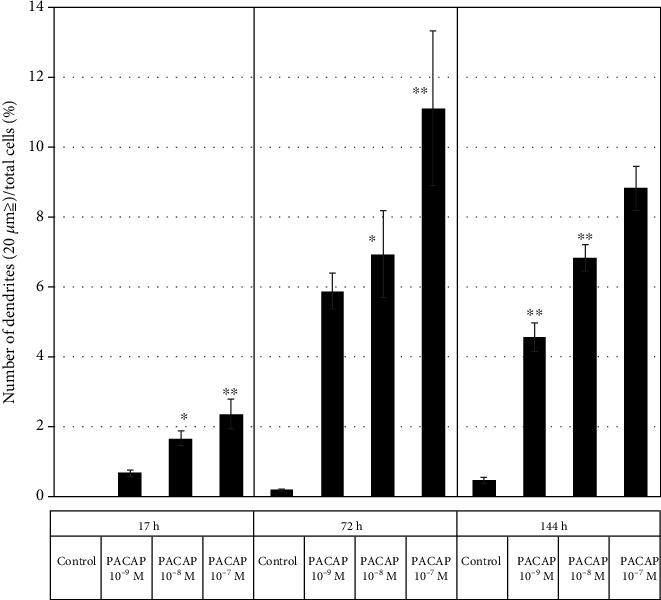
Change in the number of protrusions under different PACAP concentrations in the PC12 cells. Control: PACAP not added (n = 6); PACAP: PACAP38 concentrations added as indicated (n = 6). ∗p < 0.05 vs Control; ∗∗p < 0.01 vs Control (Tukey test). Experiments were repeated six times (n = 6). Data are presented as the mean ± SD.