
Figure 2.
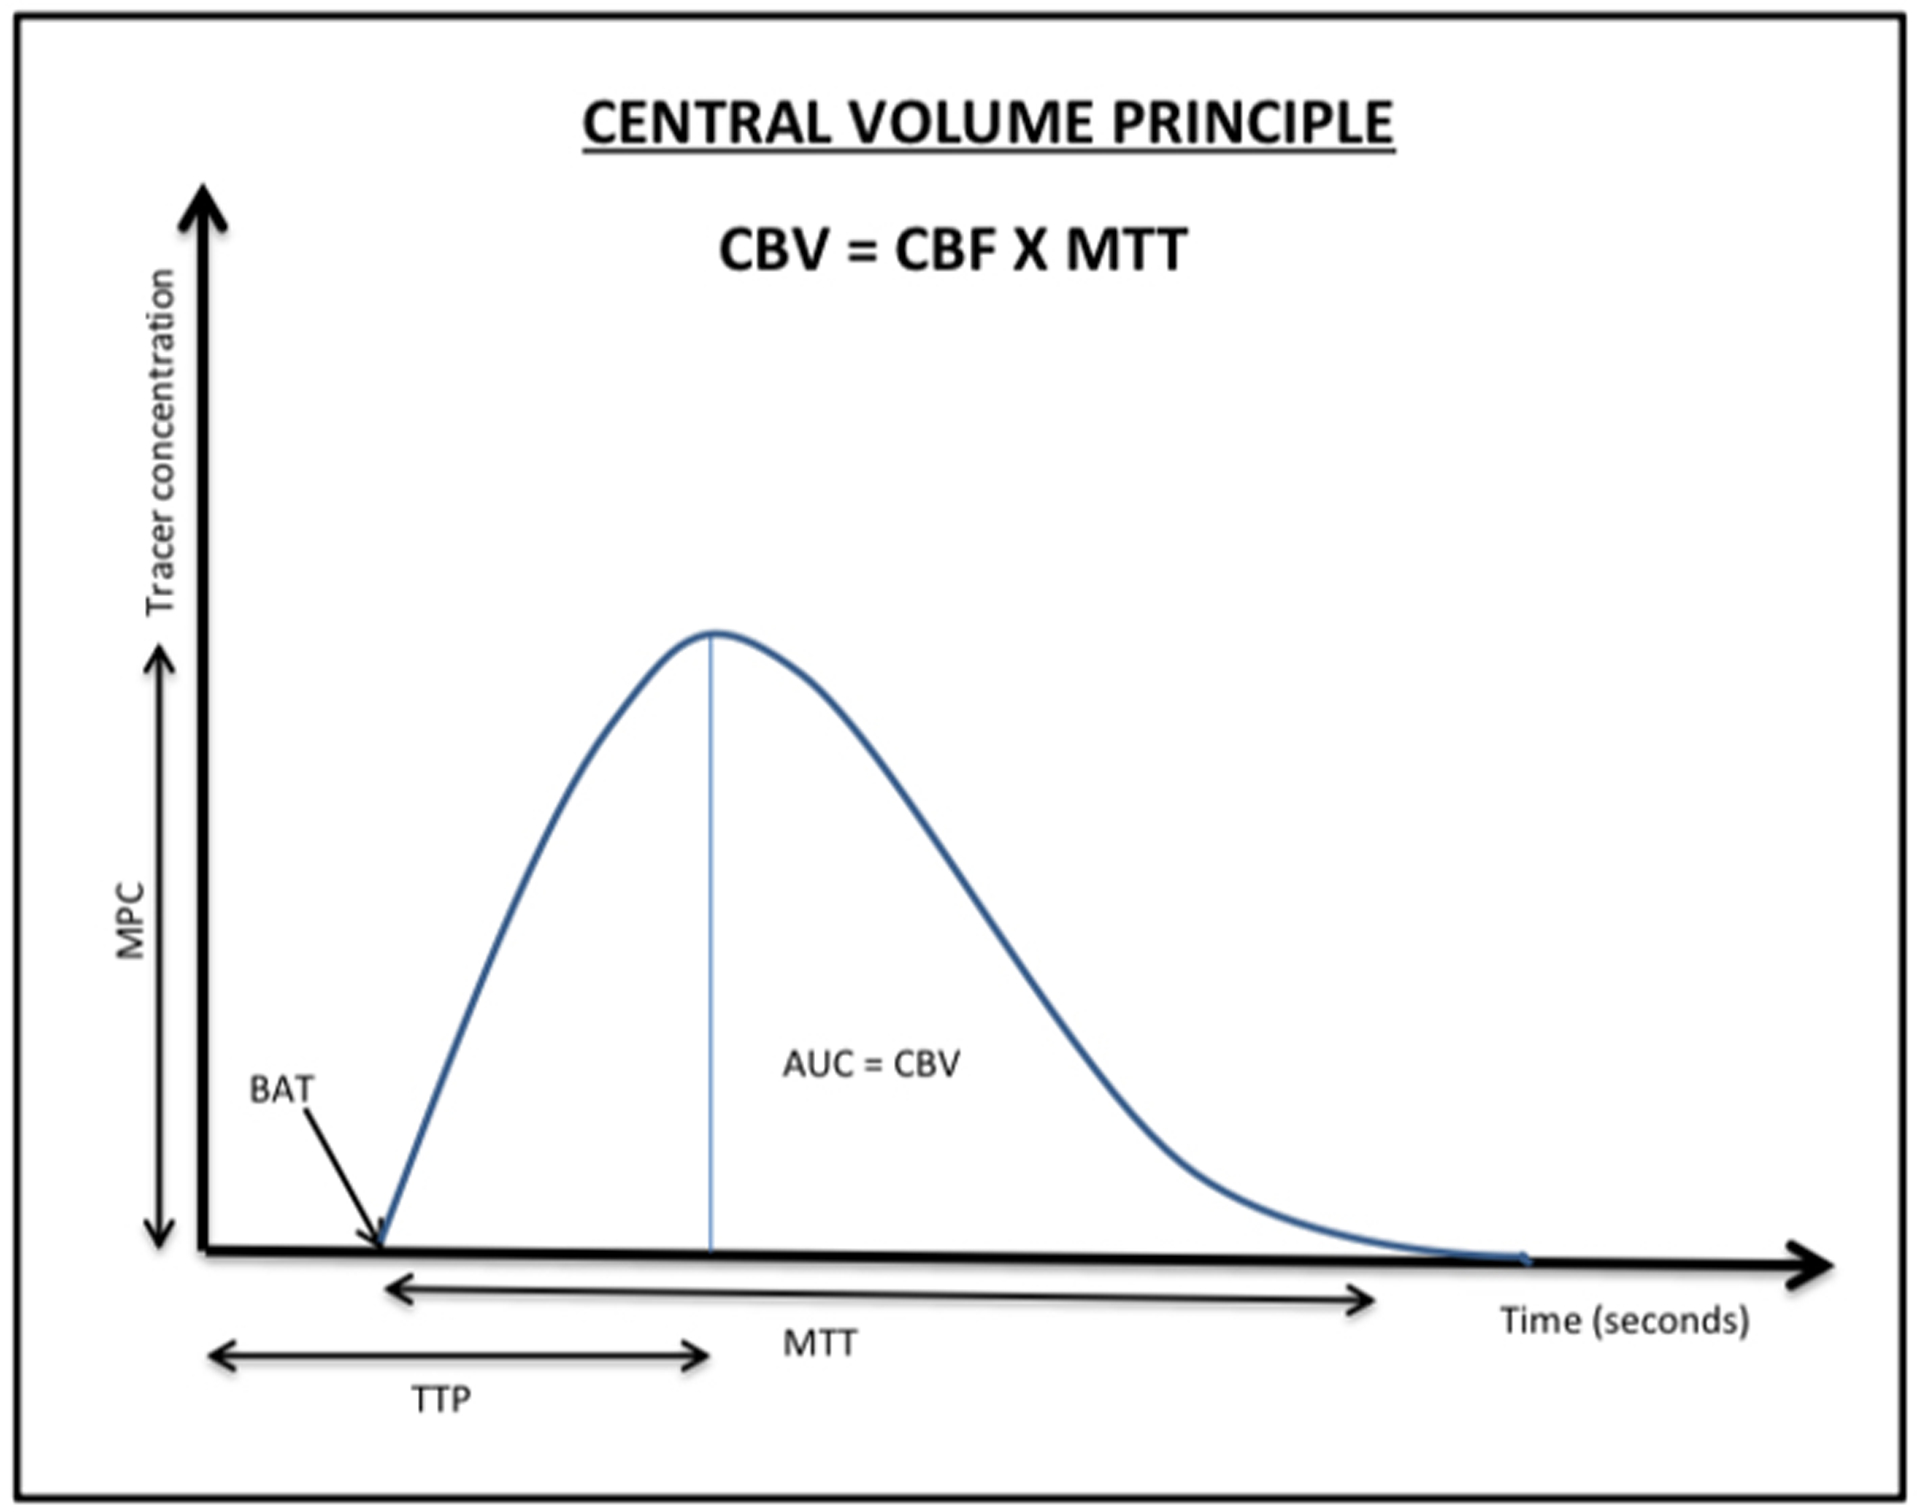
A concentration-time curve demonstrates the central volume principle, plotting time on the x-axis against tracer concentration on the y-axis. Area under the curve (AUC) quantifies to cerebral blood volume at a given time. Beginning of arrival of tracer (BAT) is the time at which contrast agent enters the arterial input. Time to peak (TTP) represents the time between the tracer injection and maximum tissue enhancement. Mean transit time (MTT) is the total time the contrast takes to move from the arterial to venous phases. Peak concentration (MPC) is the highest measured tracer concentration.