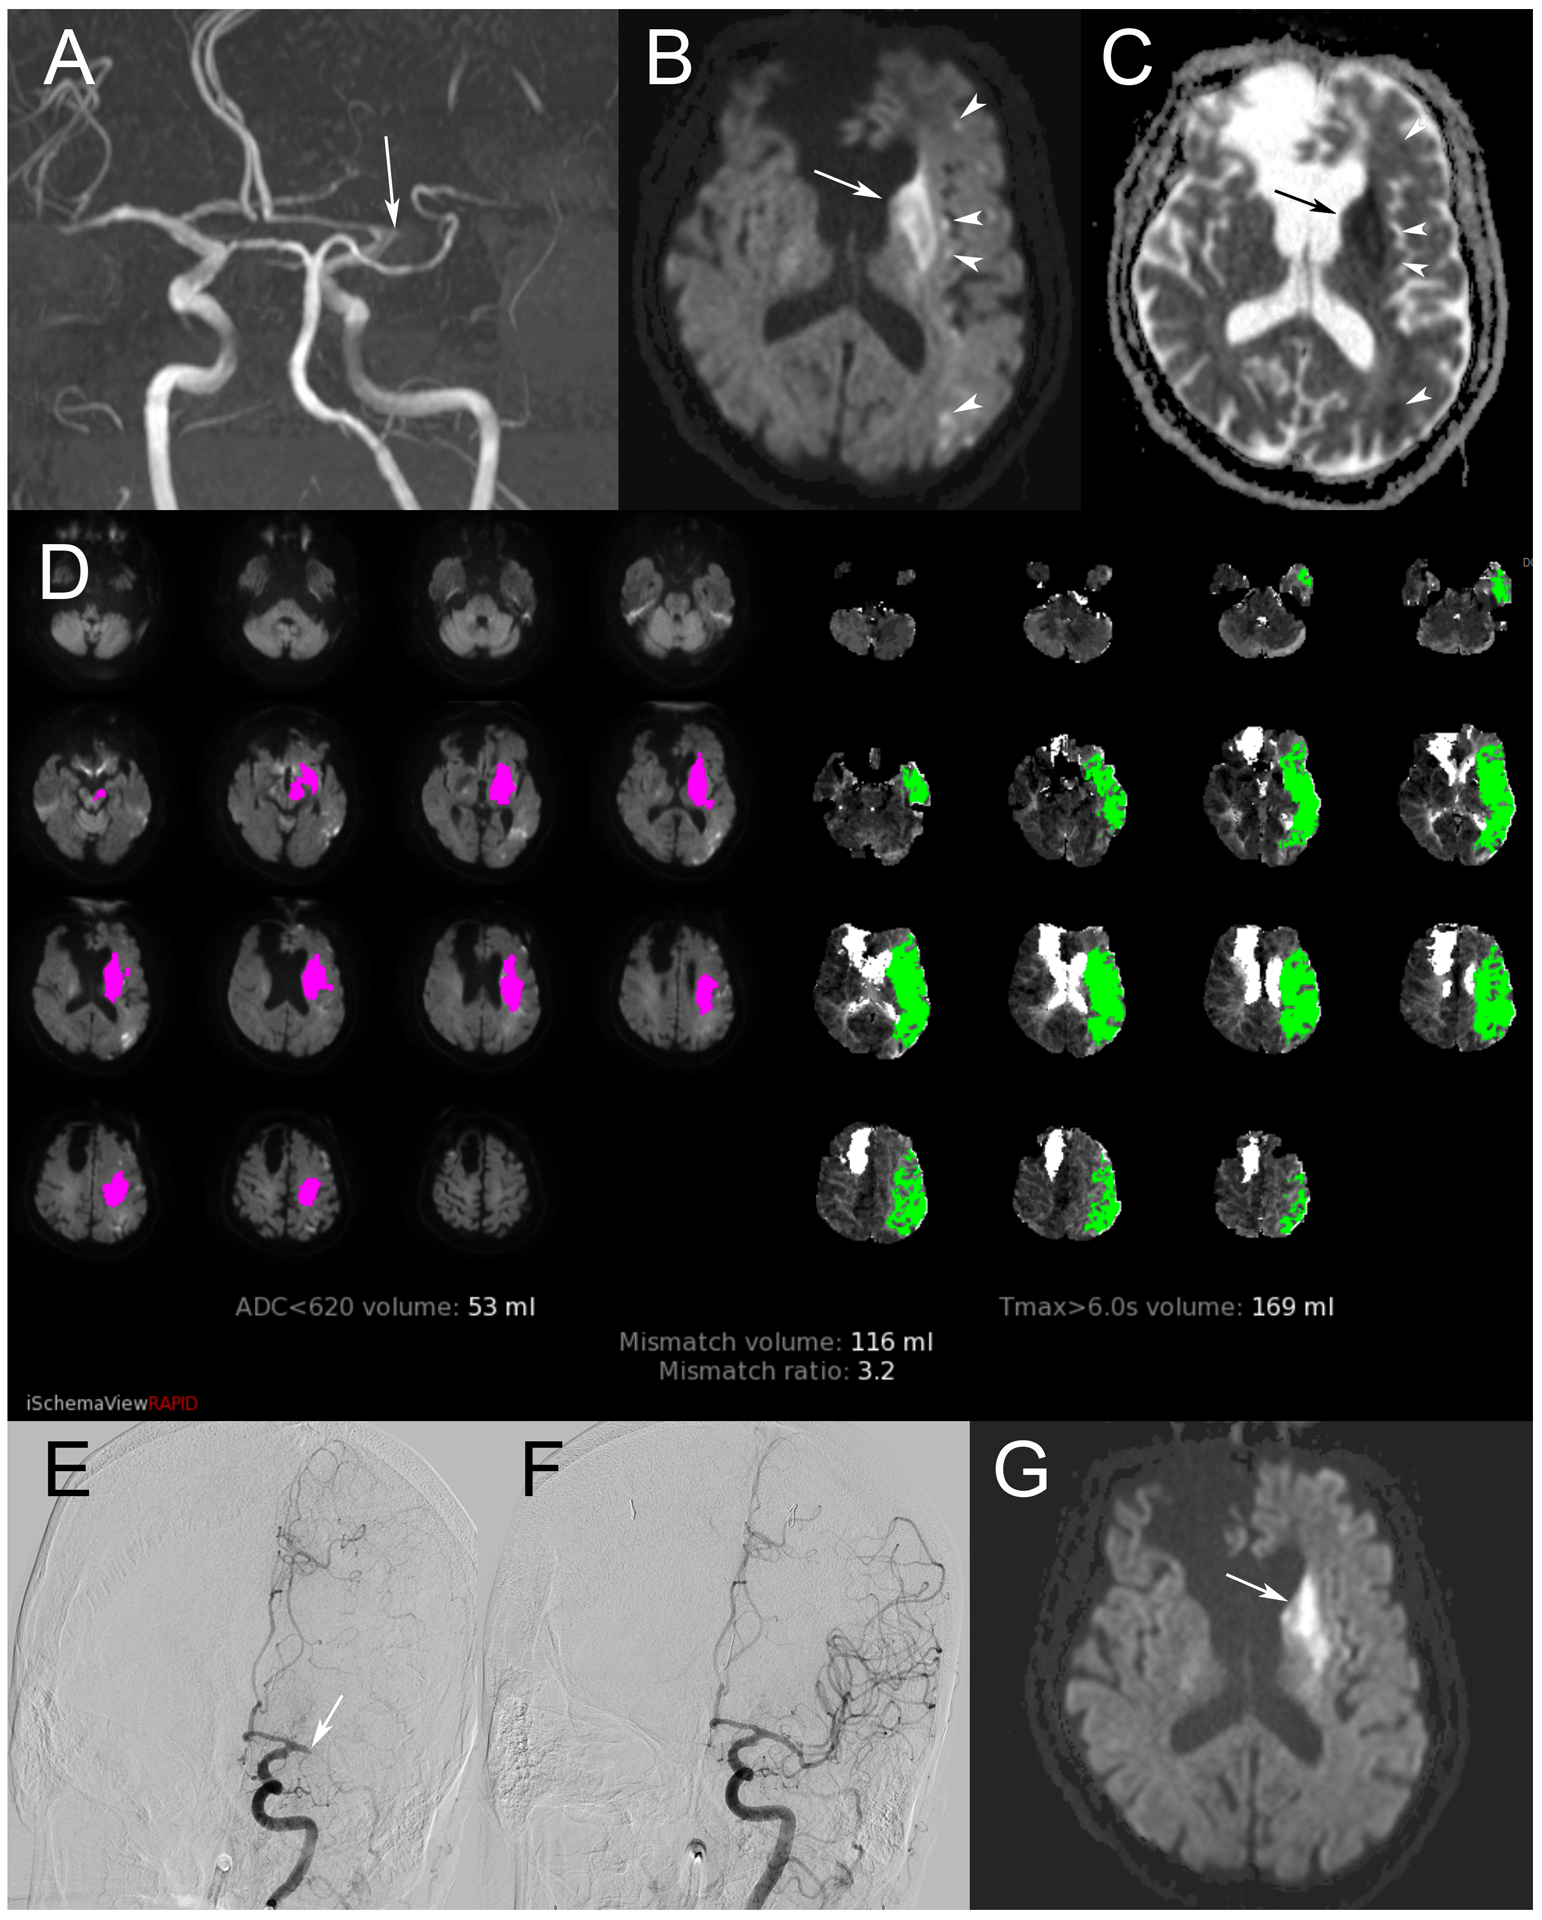
Figure 3.

A retirement-aged man presented with right hemiplegia and sensation loss, raising concern for left MCA occlusion. Symptom onset was greater than six hours at the time of presentation. Maximum intensity projection in the coronal plane of time of flight MRA (A) confirms occlusion of the left M1 segment (arrow). DWI (B) shows infarct in the caudate head and lentiform nuclei (arrow), as well as scattered areas of restricted diffusion in the left MCA territory (arrowheads). These areas are confirmed with corresponding hypointensity on ADC (C). Perfusion imaging summary image (D) demonstrates a large volume of tissue with elevated Tmax>6s, indicated by green shading. From this, volume of infarct, indicated by magenta shading, is subtracted to calculate penumbra. This patient’s calculated core and penumbra were favorable for mechanical thrombectomy. Digital subtraction angiography in the Towne’s projection during injection of the left ICA (E) confirms left M1 occlusion (arrow). Complete recanalization was achieved, seen on repeat angiography after thrombectomy (F). Stability MRI obtained 24 hours after treatment (G) again demonstrates infarct in the left deep gray structures, although there has been reversal in previously visualized areas of restricted diffusion in most other areas of the left MCA territory.
