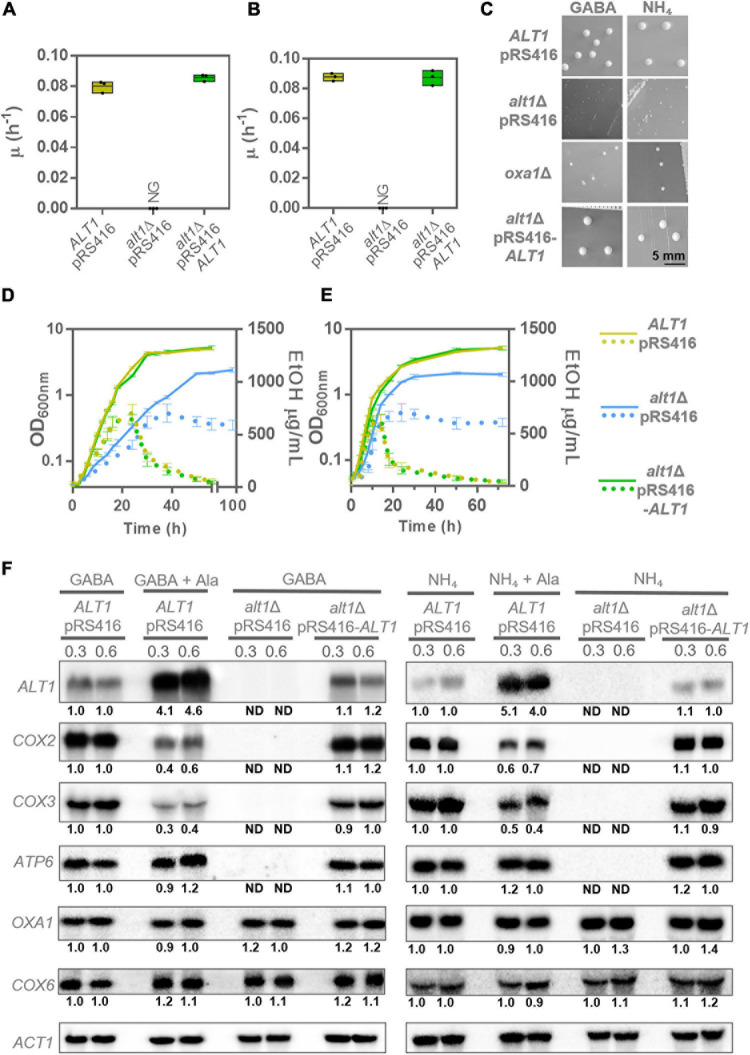
FIGURE 5.
alt1Δ mutant shows petite phenotype and severely decreased expression of various mitochondrial genes. (A) Specific growth rate in ethanol GABA. (B) Specific growth rate in ethanol ammonium. Boxes show individual values (points) and the average (middle line) ± SE of three independent experiments. (C) Colony size in glucose + GABA (GABA) and glucose + ammonium (NH4). To obtain colony size, plates were incubated at 30°C during 4 days in the case of glucose GABA (GABA) and 3 days in the case of glucose ammonium (NH4). (D) Cells were cultured to monitor biomass (solid lines) and ethanol concentration (dotted lines) in glucose + GABA. Each line represents the average ± SE of three independent experiments. (E) Cells were cultured to monitor biomass (solid lines) and ethanol concentration (dotted lines) in glucose + ammonium. Each line represents the average ± SE of three independent experiments. (F) Northern blot in glucose + GABA (GABA) and glucose + ammonium (NH4) to determine the expression of mitochondrial genes (COX2, COX3, and ATP6) in the presence of alanine (+Ala) and in the alt1Δ mutant at OD600nm = 0.3 and 0.6. Alanine was added to observe the effect on the mitochondrial gene expression. COX6 and OXA1 are nuclear genes and were tested to determine any possible effect of alanine addition or ALT1 absence. Numbers below the blots represent the fold change with respect to the ALT1 pRS416 strain grown in GABA or ammonium (rows 1 and 2 of each Northern assay) after quantification and normalization relative to ACT1. Abbreviations: NG, no growth; ND, not detected.

