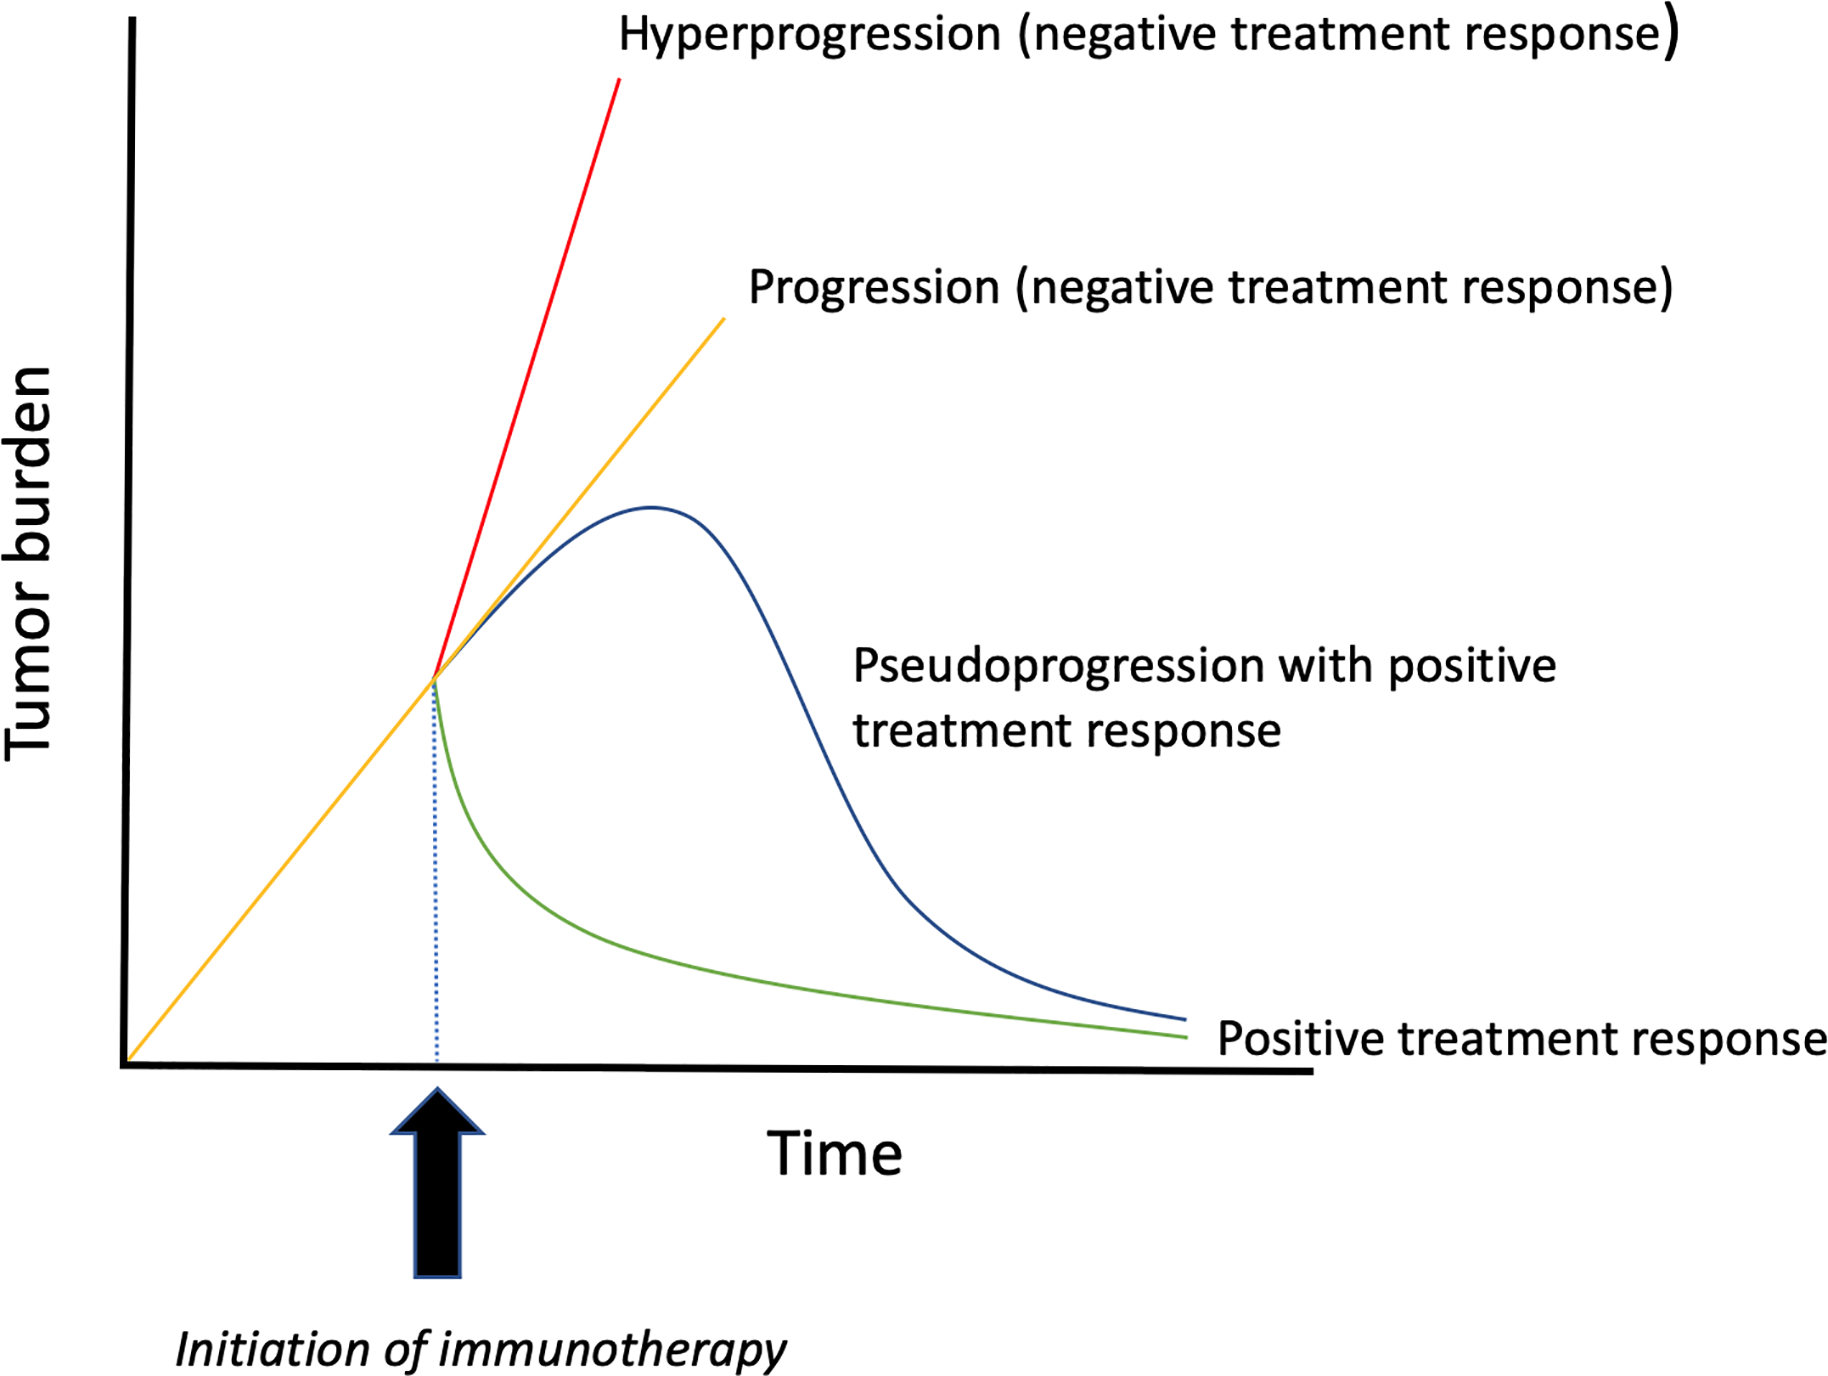
Figure 2.

Schematic comparing response patterns following immunotherapy. Hyperprogression (red line) indicates a rapid increase in disease burden following immunotherapy, such that disease progresses at a significantly faster rate when compared to the pre-immunotherapy period. In routine progression (yellow line), tumor growth is grossly unchanged or only slightly diminished after initiation of immunotherapy. In pseudoprogression (blue line), tumors initially increase in size, however, subsequent anatomic or metabolic imaging demonstrates a decrease in disease burden. The green curve represents a typical response pattern, with tumor shrinkage following treatment.
