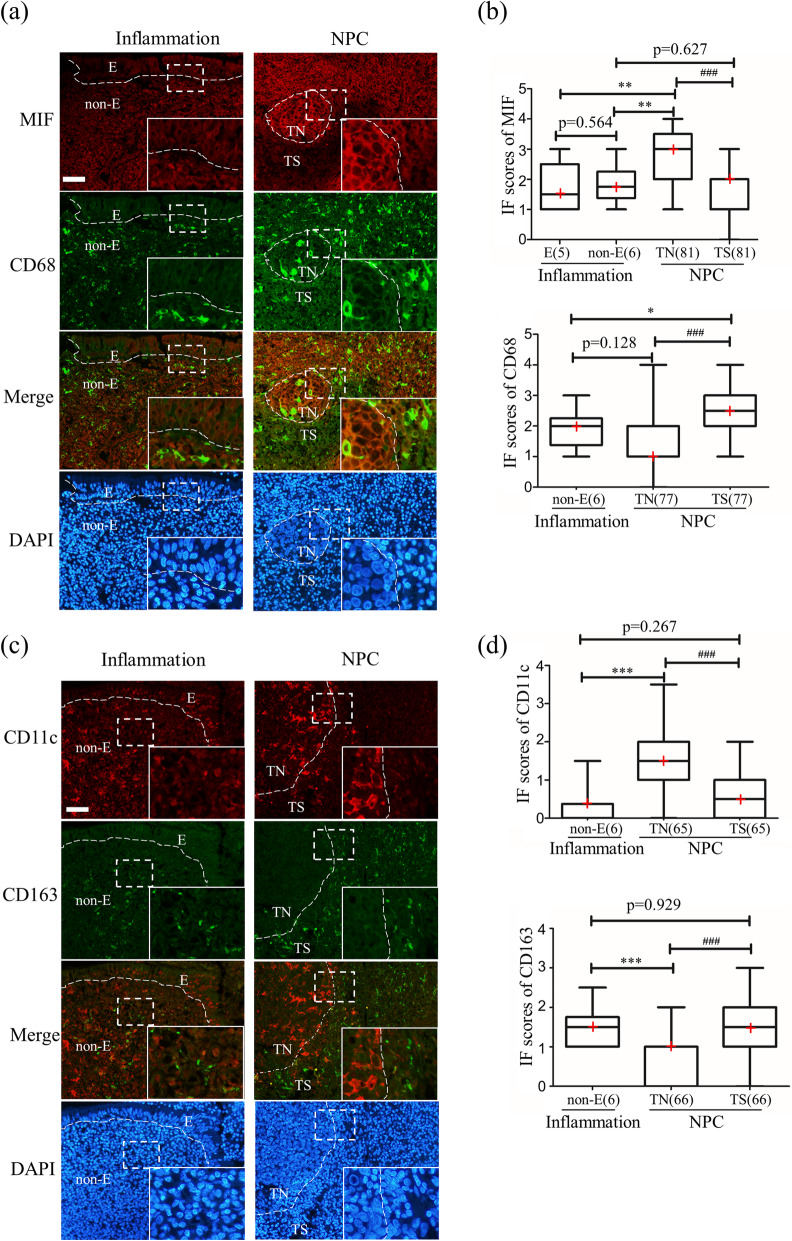
Fig. 1.
Immunofluorescence of macrophage migration inhibitory factor (MIF) and macrophage markers in NPC tissues. (a) Representative images of the inflammation and NPC images of MIF (red), CD68 (green), merged images of the red and green channels, and nuclei counterstained using DAPI. (b) Graphic presentation of the IF scores for MIF and CD68. (c) Representative images of CD11c (red), CD163 (green), merged images, and DAPI. (d) Graphic presentation of IF scores for CD11c and CD163. “E” indicates epithelia, “non-E” indicates the non-epithelial area, “TN” indicates tumor nest, “TS” indicates tumor stroma. The red cross in the graphic represents the median. *: p < 0.05, **: p < 0.01, ***: p < 0.001 analyzed by unpaired test, ###: p < 0.001 analyzed by paired test. An enlarged image is shown in the inset. Scale bar represents 50 μm

